import lightningchart as lc
lc.set_license('my-license-key')
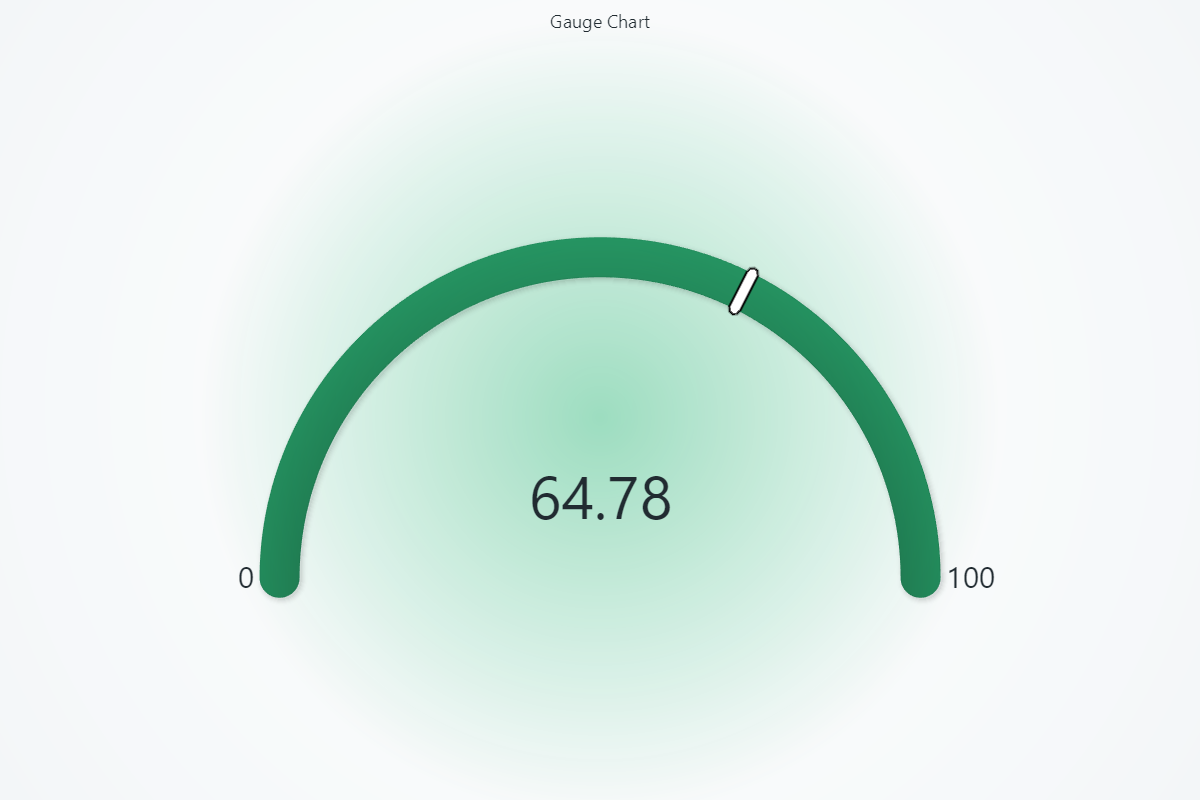
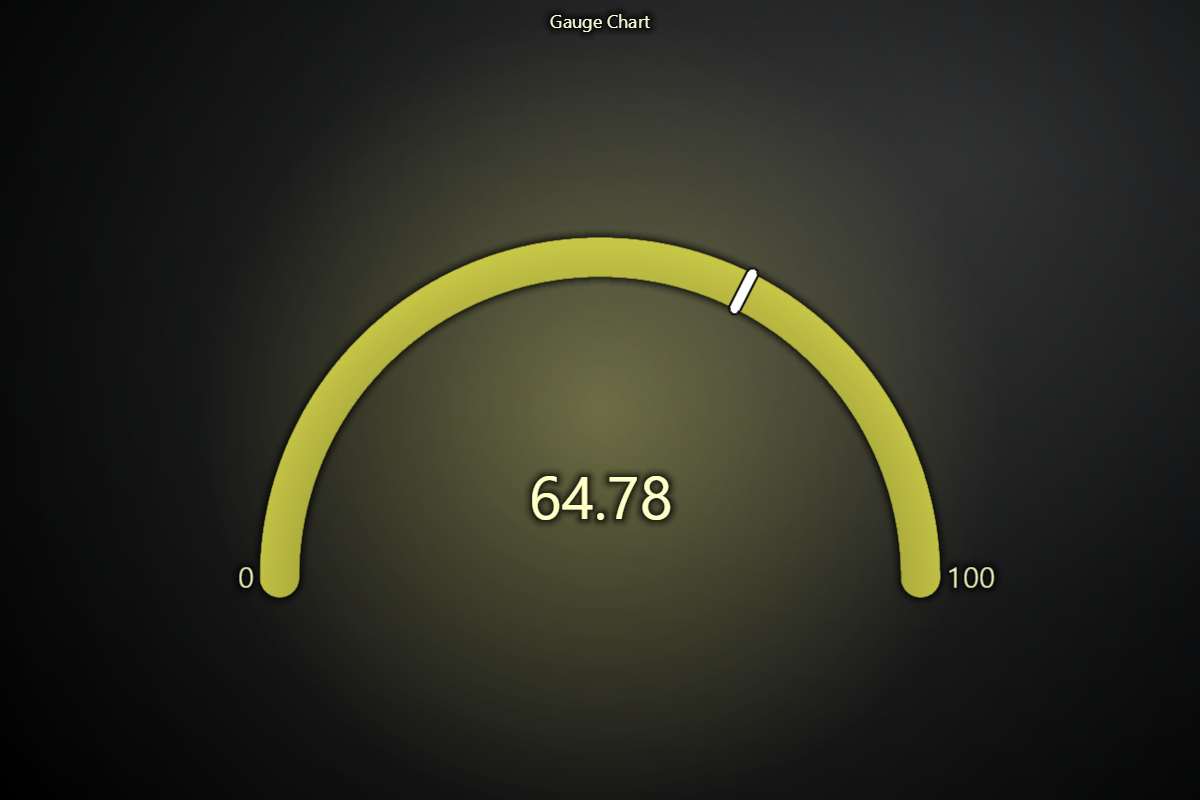
chart = lc.GaugeChart(
theme=lc.Themes.Light,
title='Gauge Chart'
)
chart.set_angle_interval(start=225, end=-45)
chart.set_interval(start=0, end=100)
chart.set_value(64.78)
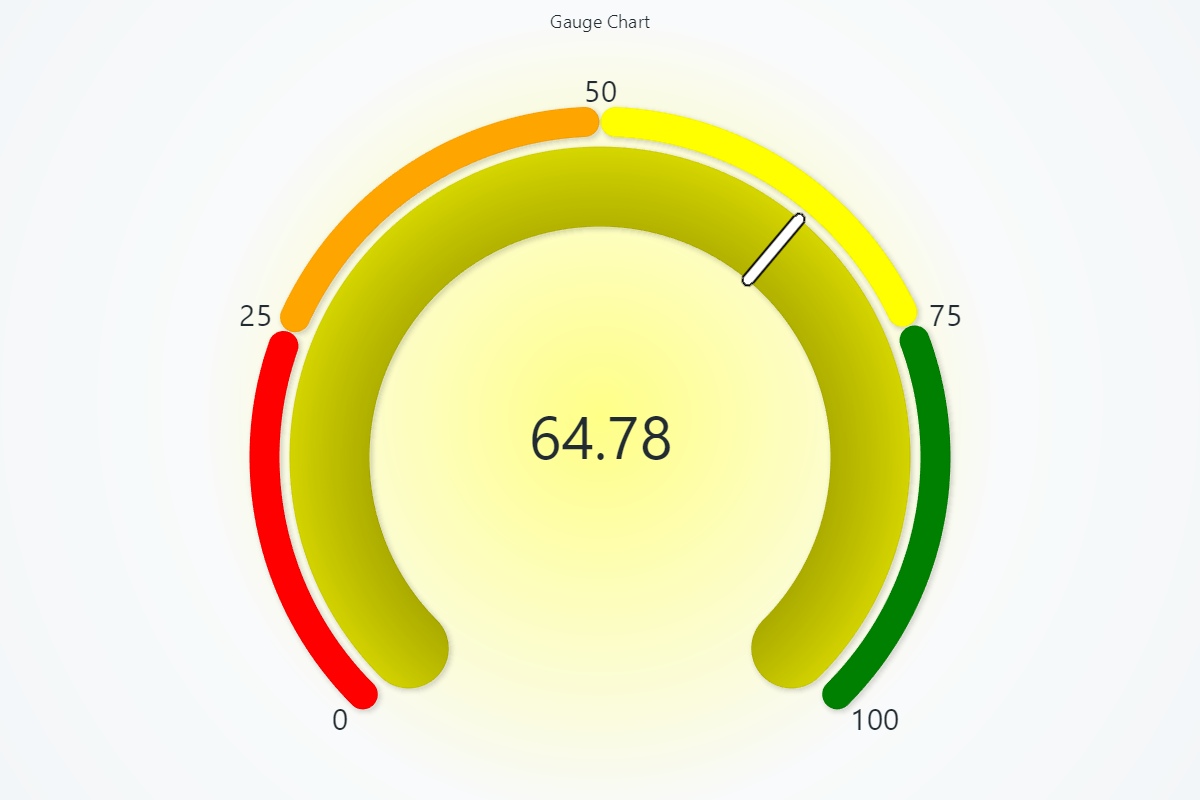
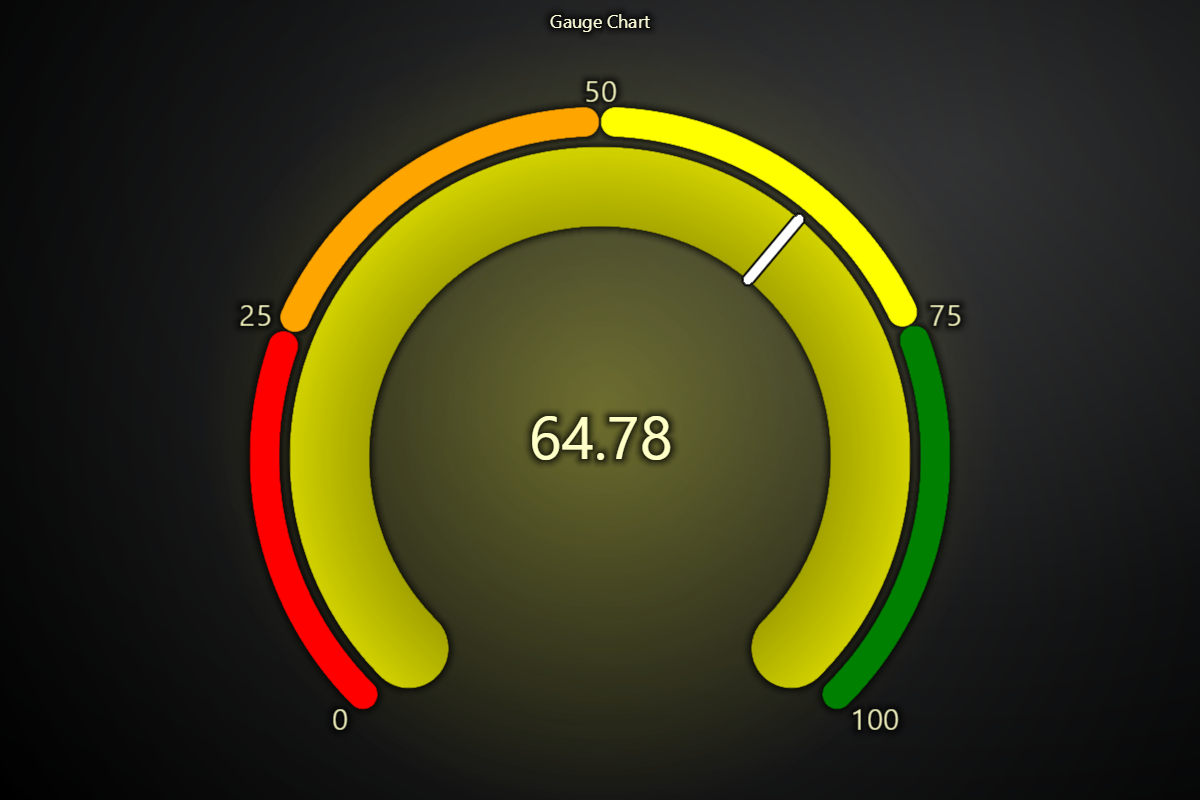
chart.set_value_indicators([
{ 'start': 0, 'end': 25, 'color': ('red') },
{ 'start': 25, 'end': 50, 'color': ('orange') },
{ 'start': 50, 'end': 75, 'color': ('yellow') },
{ 'start': 75, 'end': 100, 'color': ('green') },
])
chart.set_bar_thickness(80)
chart.set_value_indicator_thickness(30)
chart.open()