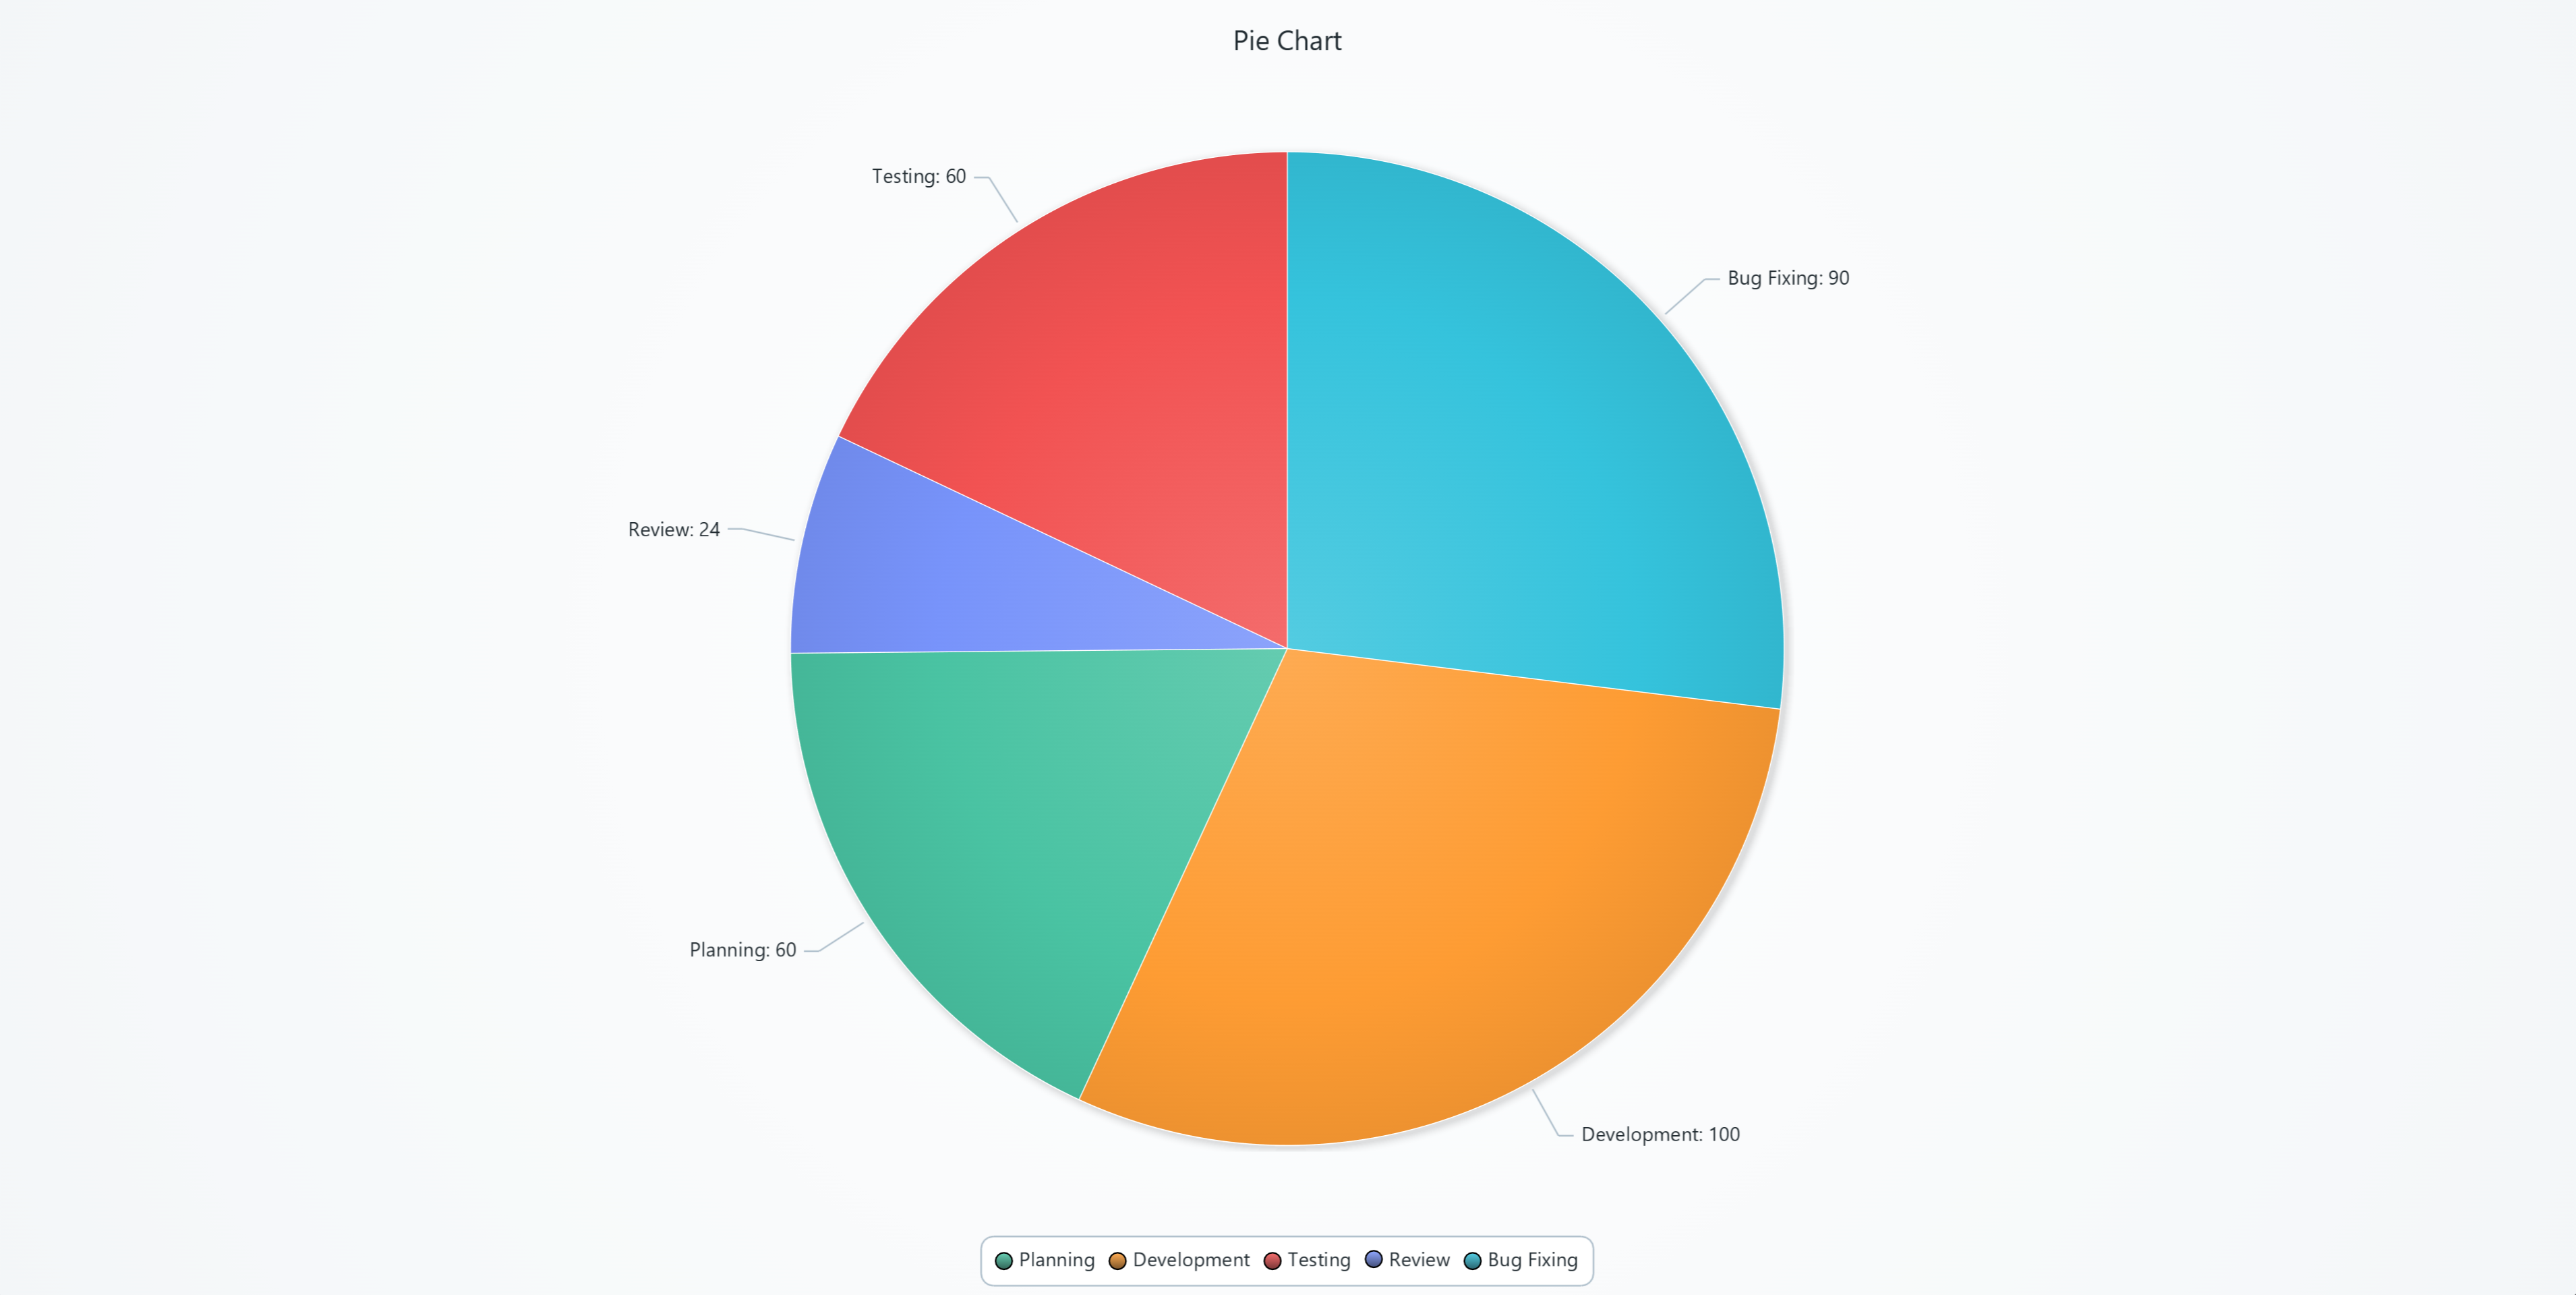
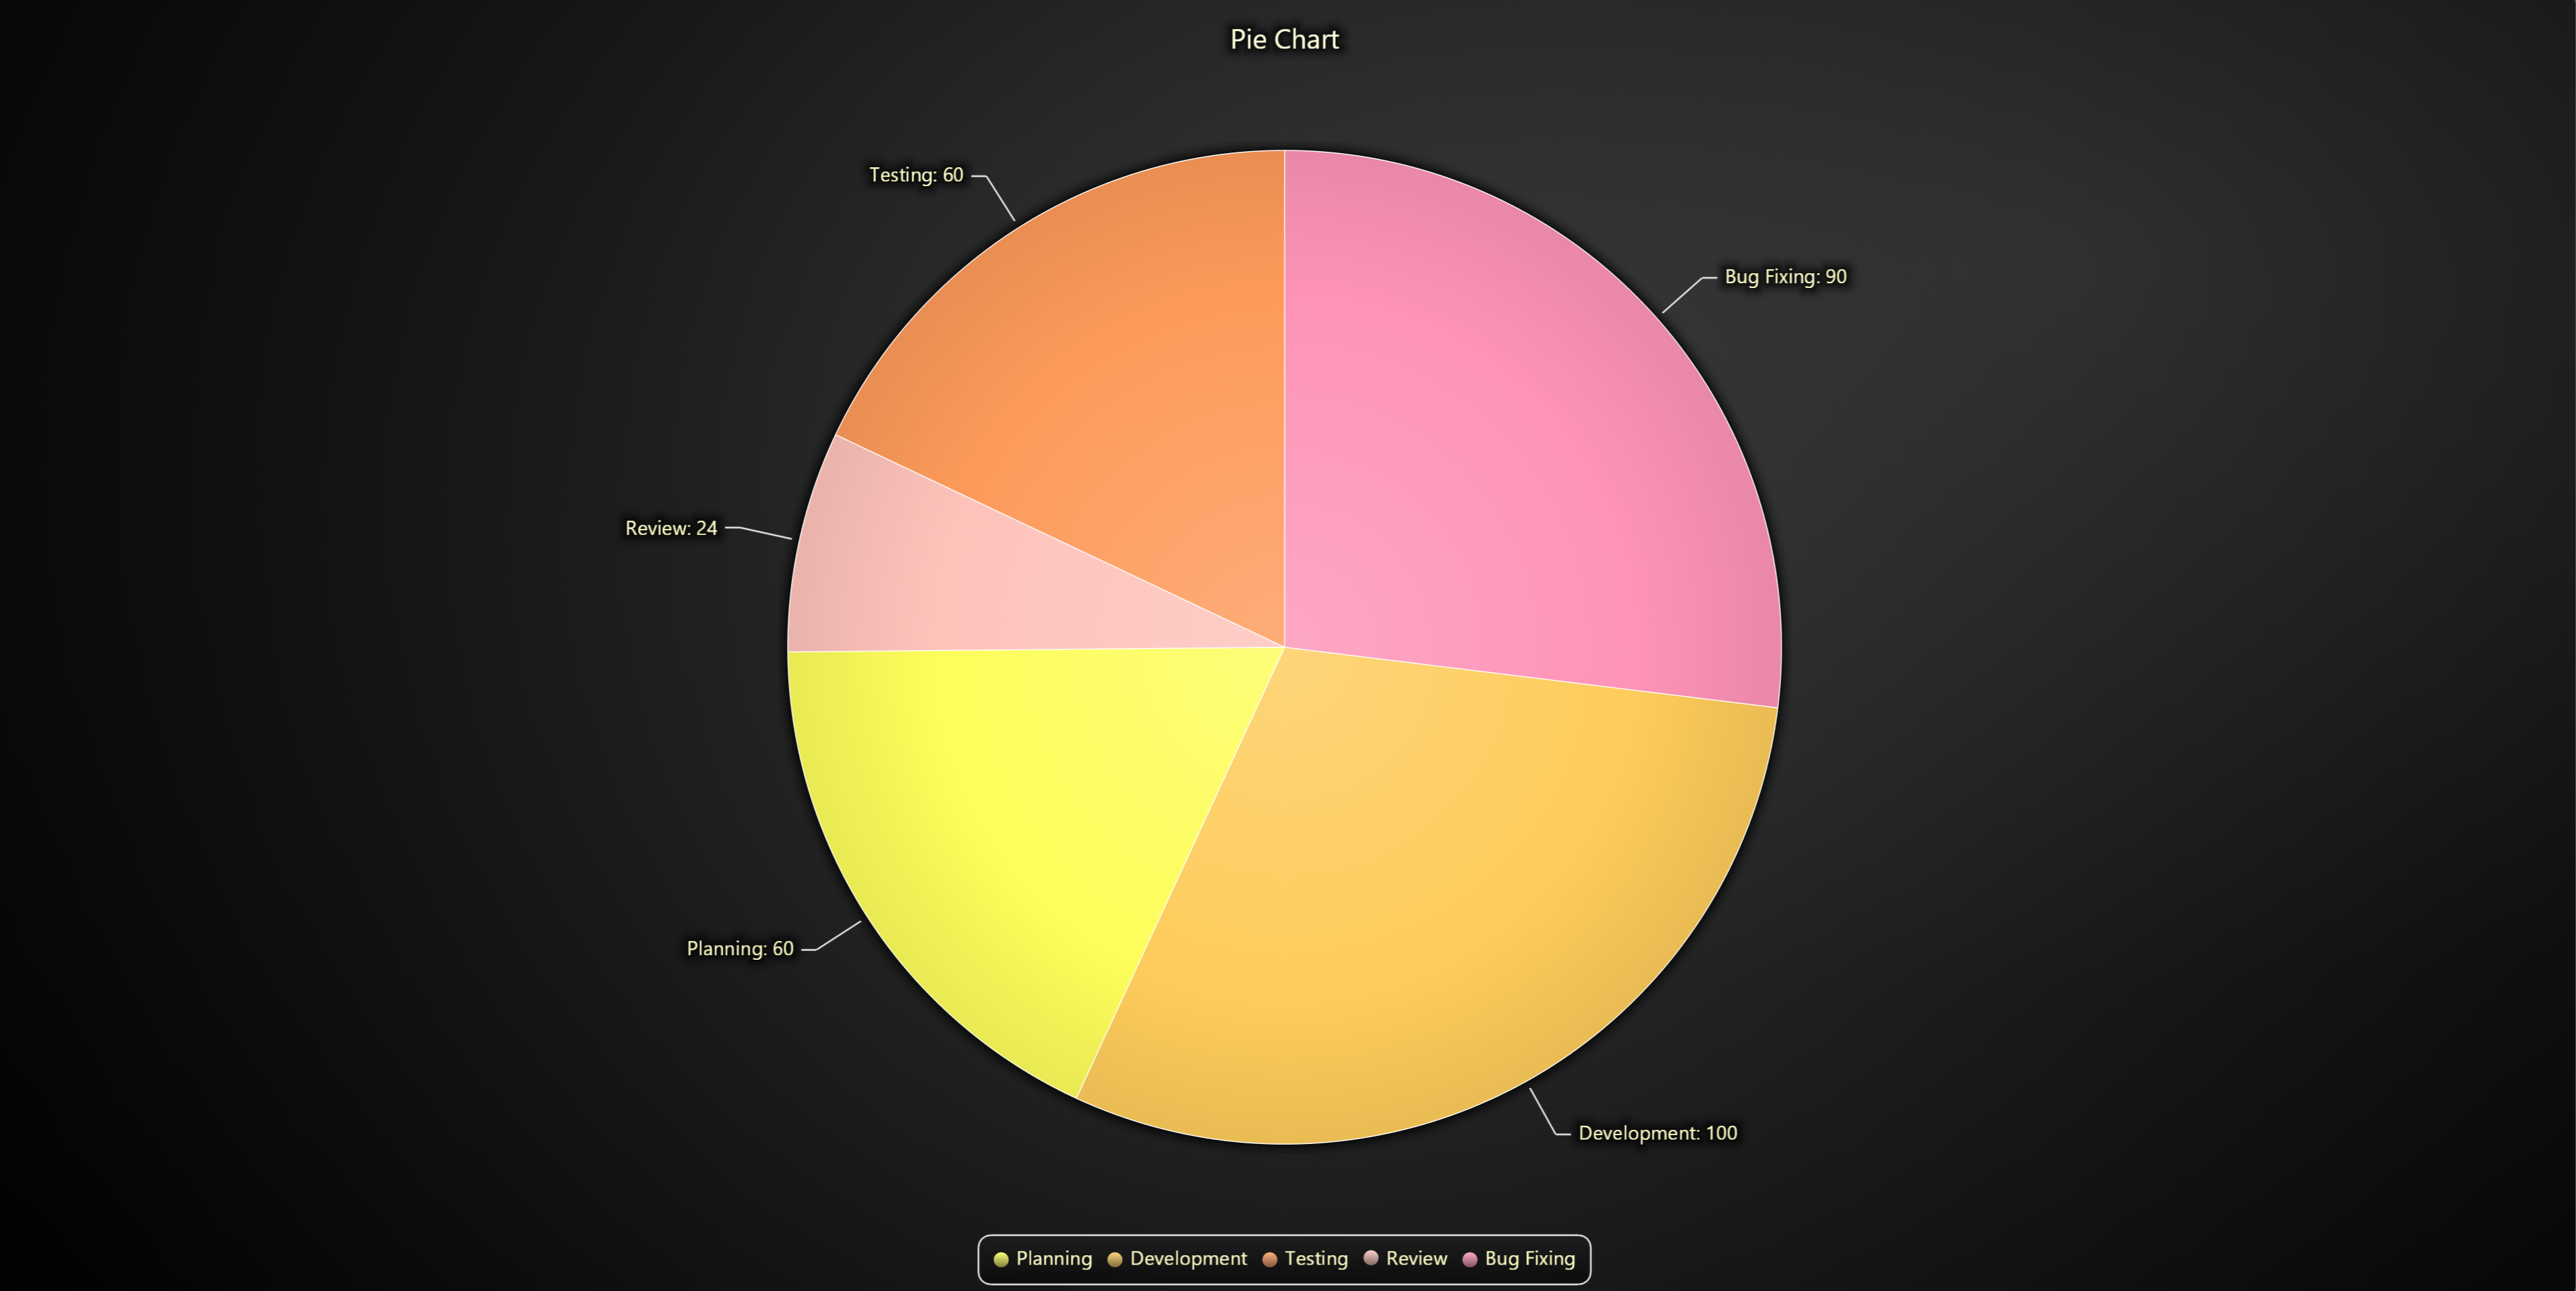
Pie Chart
import lightningchart as lc

# Set your LightningChart license key
lc.set_license('my-license-key')

data = [
    {'name': 'Planning', 'value': 60},
    {'name': 'Development', 'value': 100},
    {'name': 'Testing', 'value': 60},
    {'name': 'Review', 'value': 24},
    {'name': 'Bug Fixing', 'value': 90},
]

# Create the pie chart
chart = lc.PieChart(
    title='Pie Chart',
    theme=lc.Themes.Light
)

# Separate the slices with white stroke
chart.set_slice_stroke(color=('white'), thickness=1)

chart.add_slices(data)

chart.open()
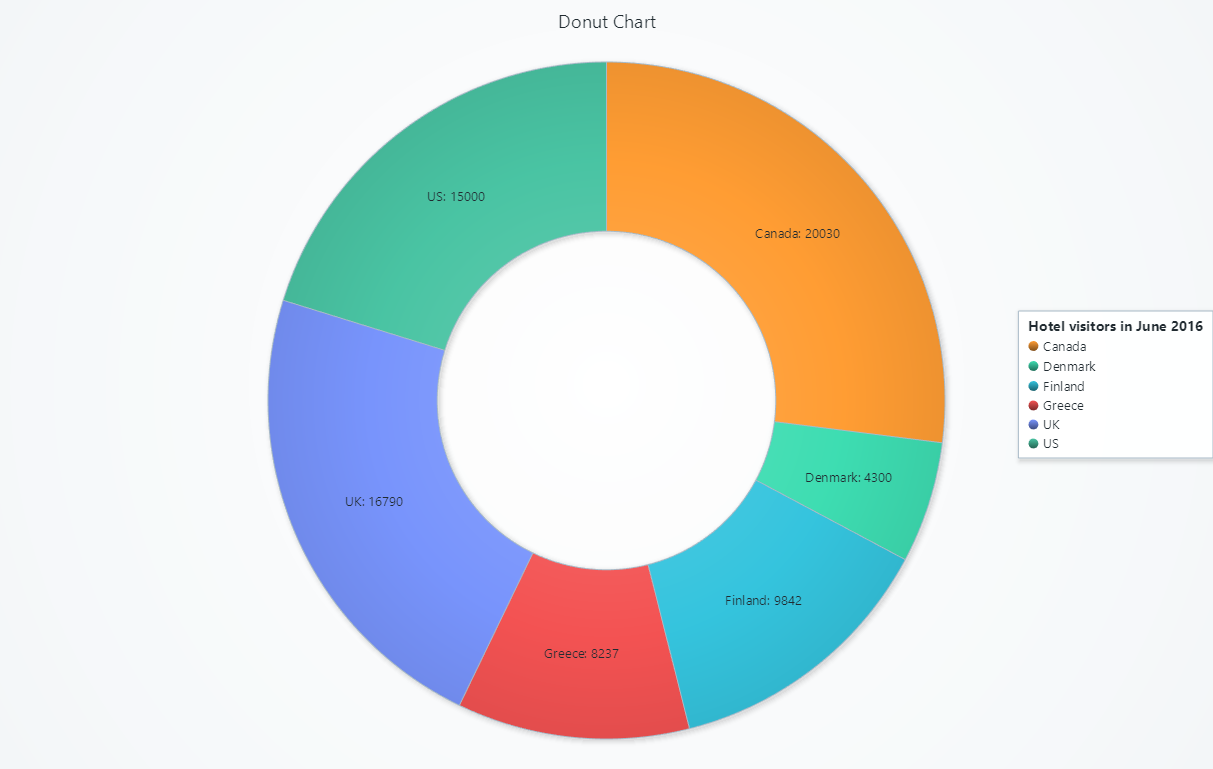
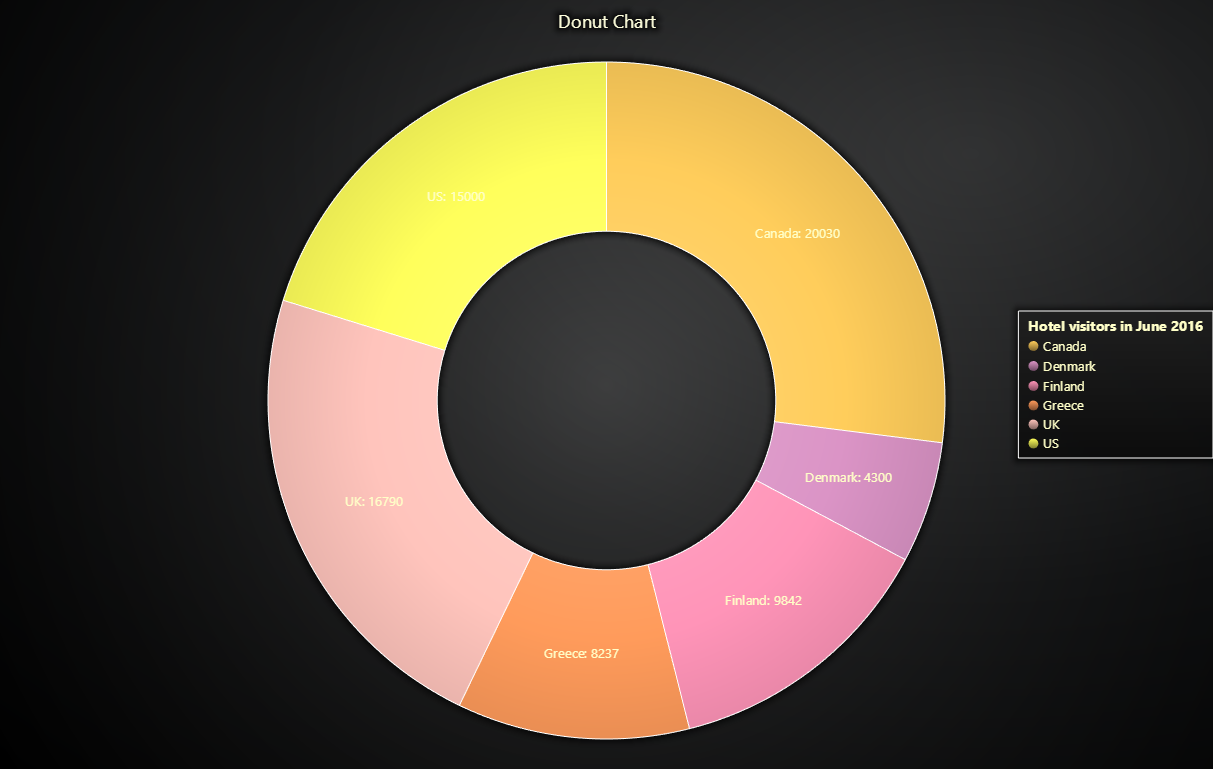
Donut Chart
import lightningchart as lc

lc.set_license('my-license-key')

data = {
    'country': ['US', 'Canada', 'Greece', 'UK', 'Finland', 'Denmark'],
    'values': [15000, 20030, 8237, 16790, 9842, 4300],
}

chart = lc.PieChart(
    labels_inside_slices=True,
    title='Donut Chart',
    theme=lc.Themes.Light,
    legend={
        'title': 'Hotel visitors in June 2016',
        'position': 'RightCenter'
    }
)

slices = []

for i in range(len(data['values'])):
    slices.append({
        'name': data['country'][i],
        'value': data['values'][i],
    })

chart.set_label_formatter('NamePlusValue')
chart.add_slices(slices)
chart.set_inner_radius(50)

chart.open()