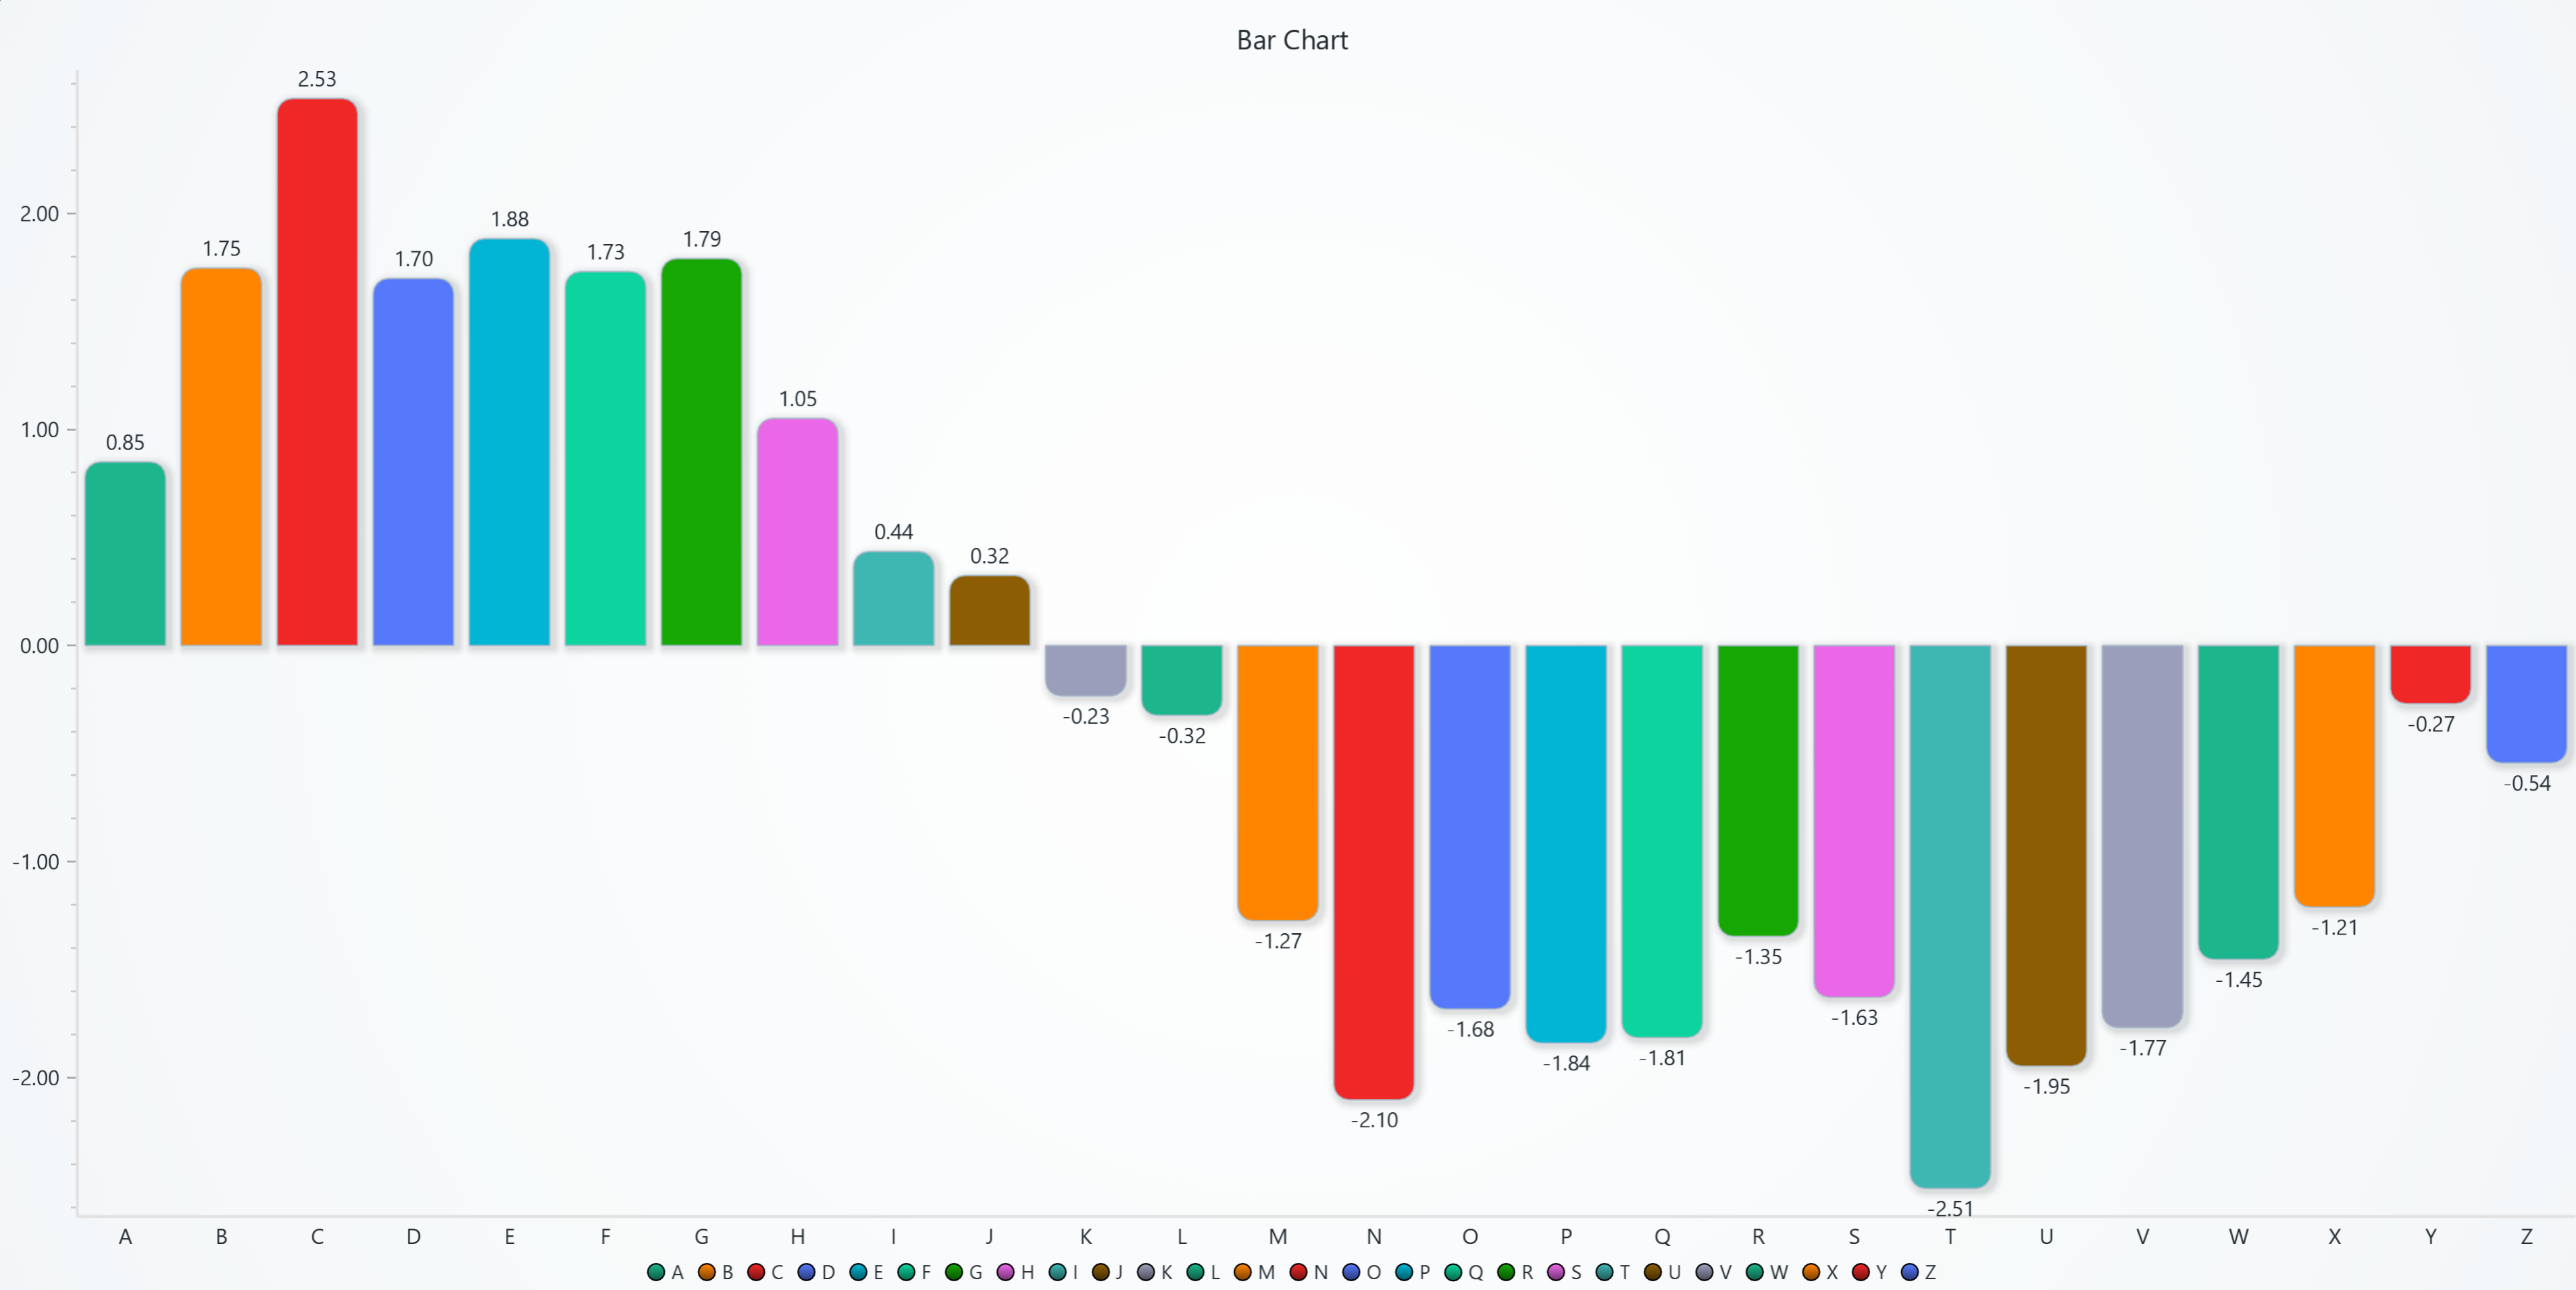
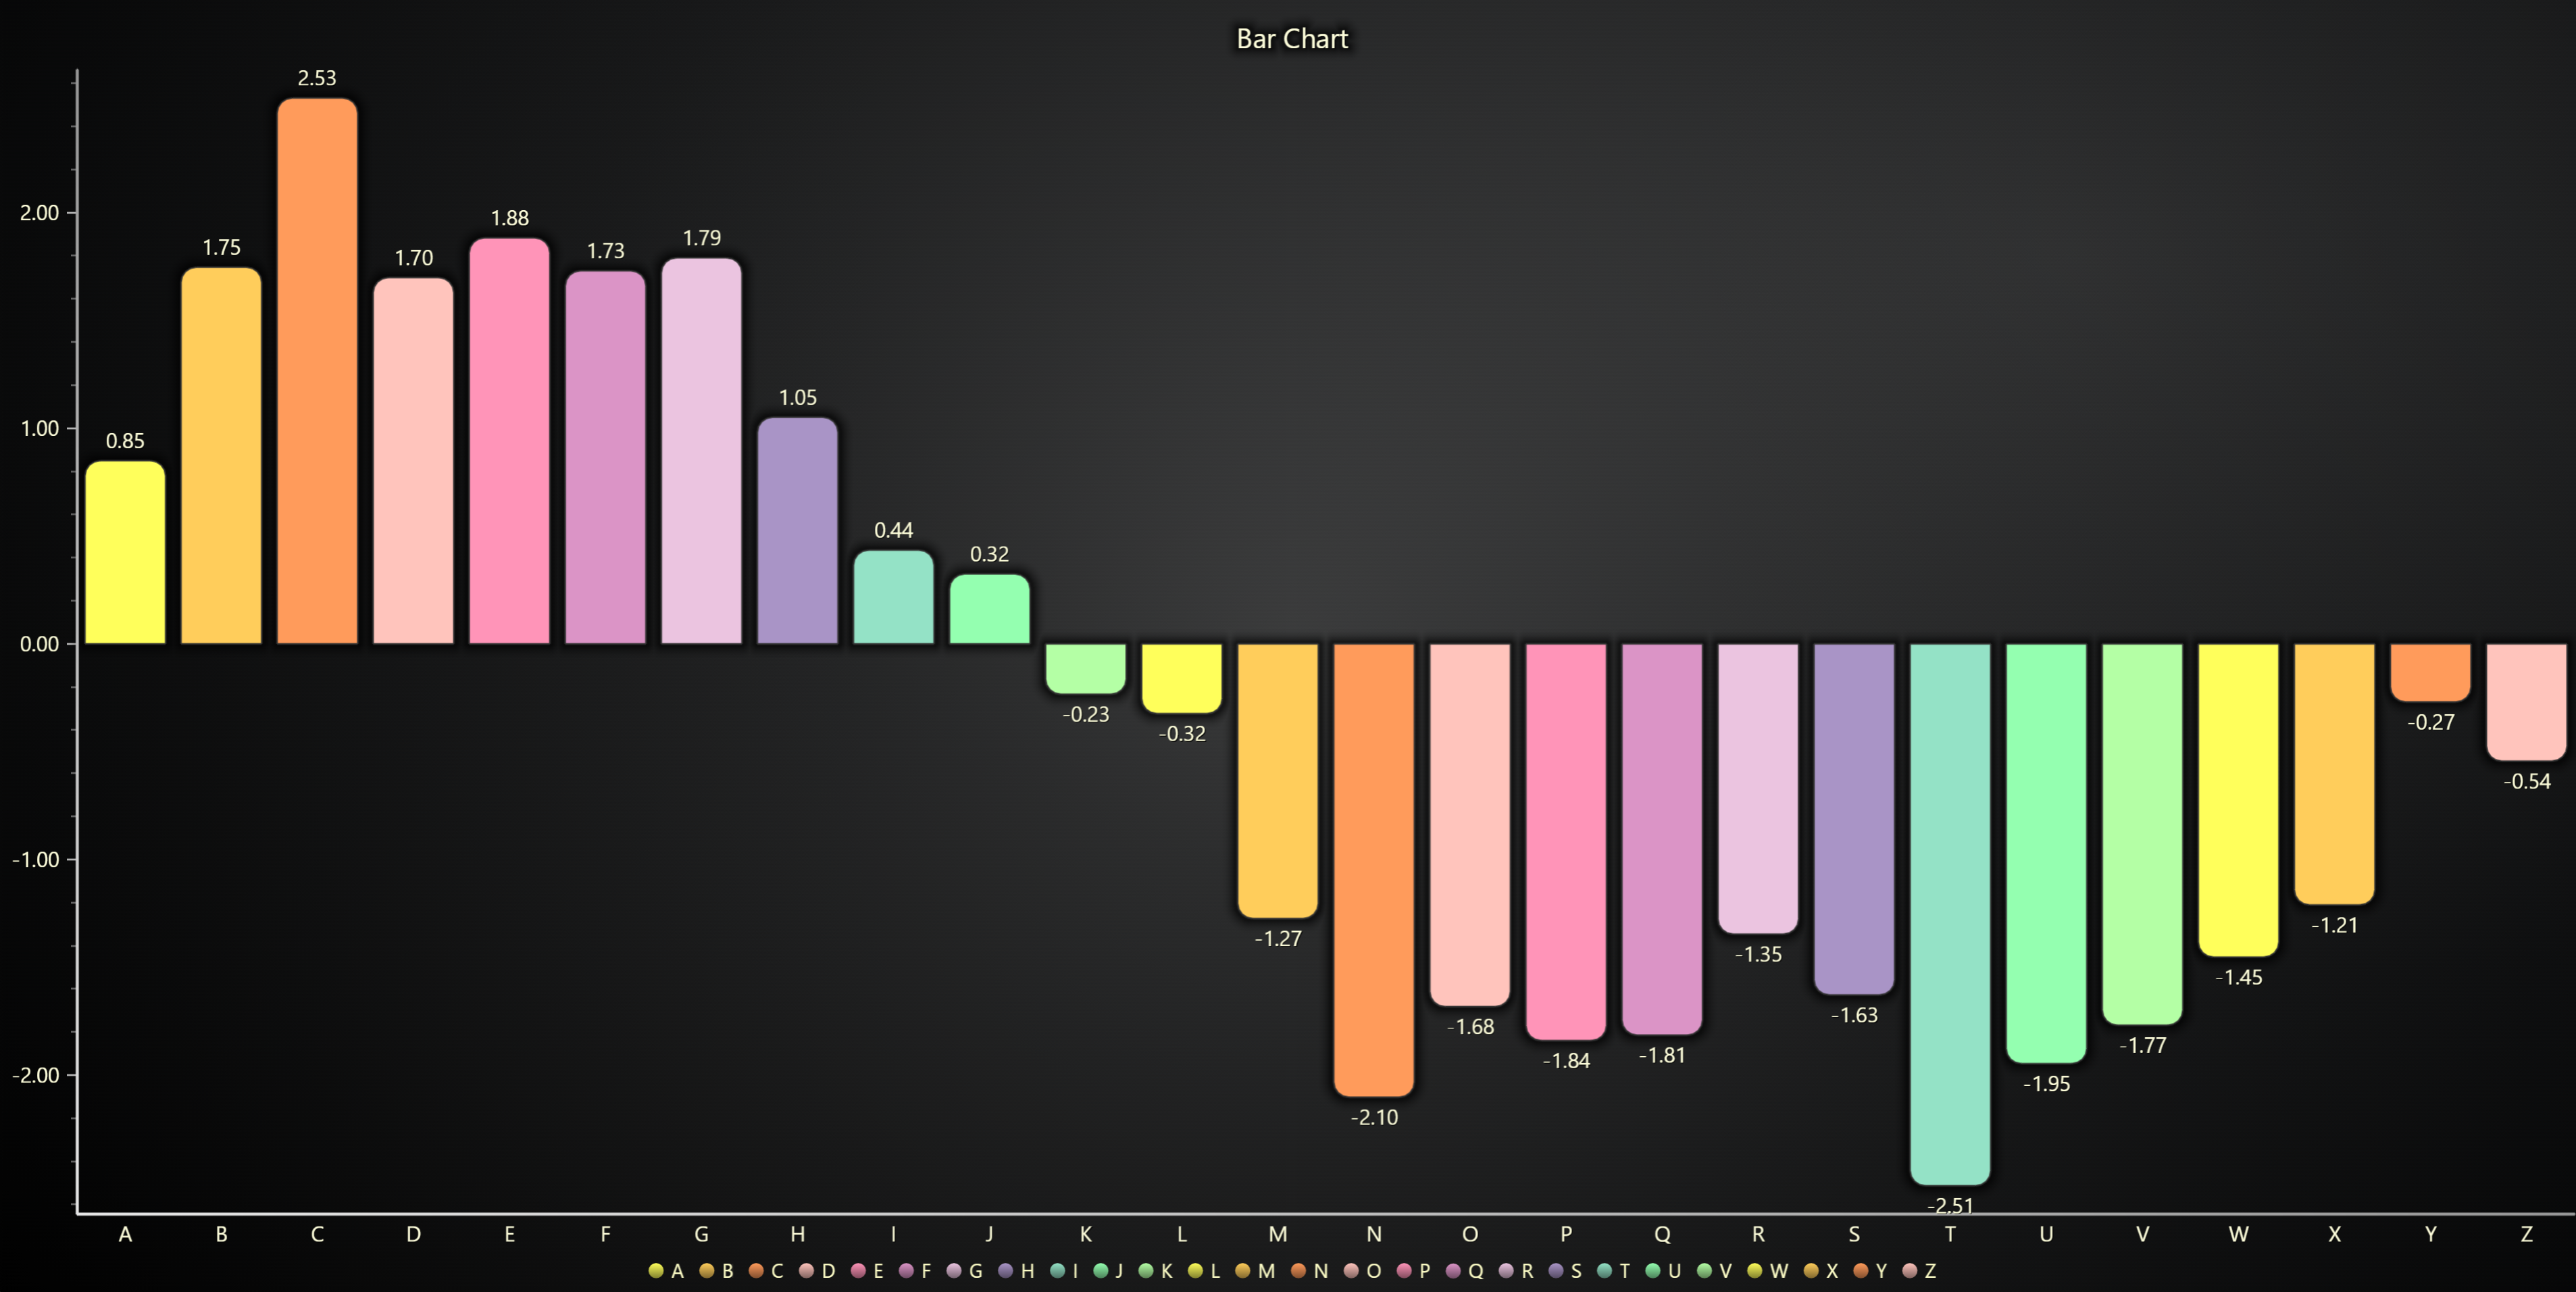
Bar Chart
import lightningchart as lc
import random

lc.set_license('my-license-key')

data = []
value = 0
for i in range(1, 27):
    value += (random.random() * 2) - 1
    data.append({'category': chr(ord('A') + i - 1), 'value': value})

chart = lc.BarChart(
    vertical=True,
    theme=lc.Themes.Light,
    title='Bar Chart'
)
chart.set_sorting('disabled')
chart.set_data(data)
chart.open()
Stacked Bar Chart
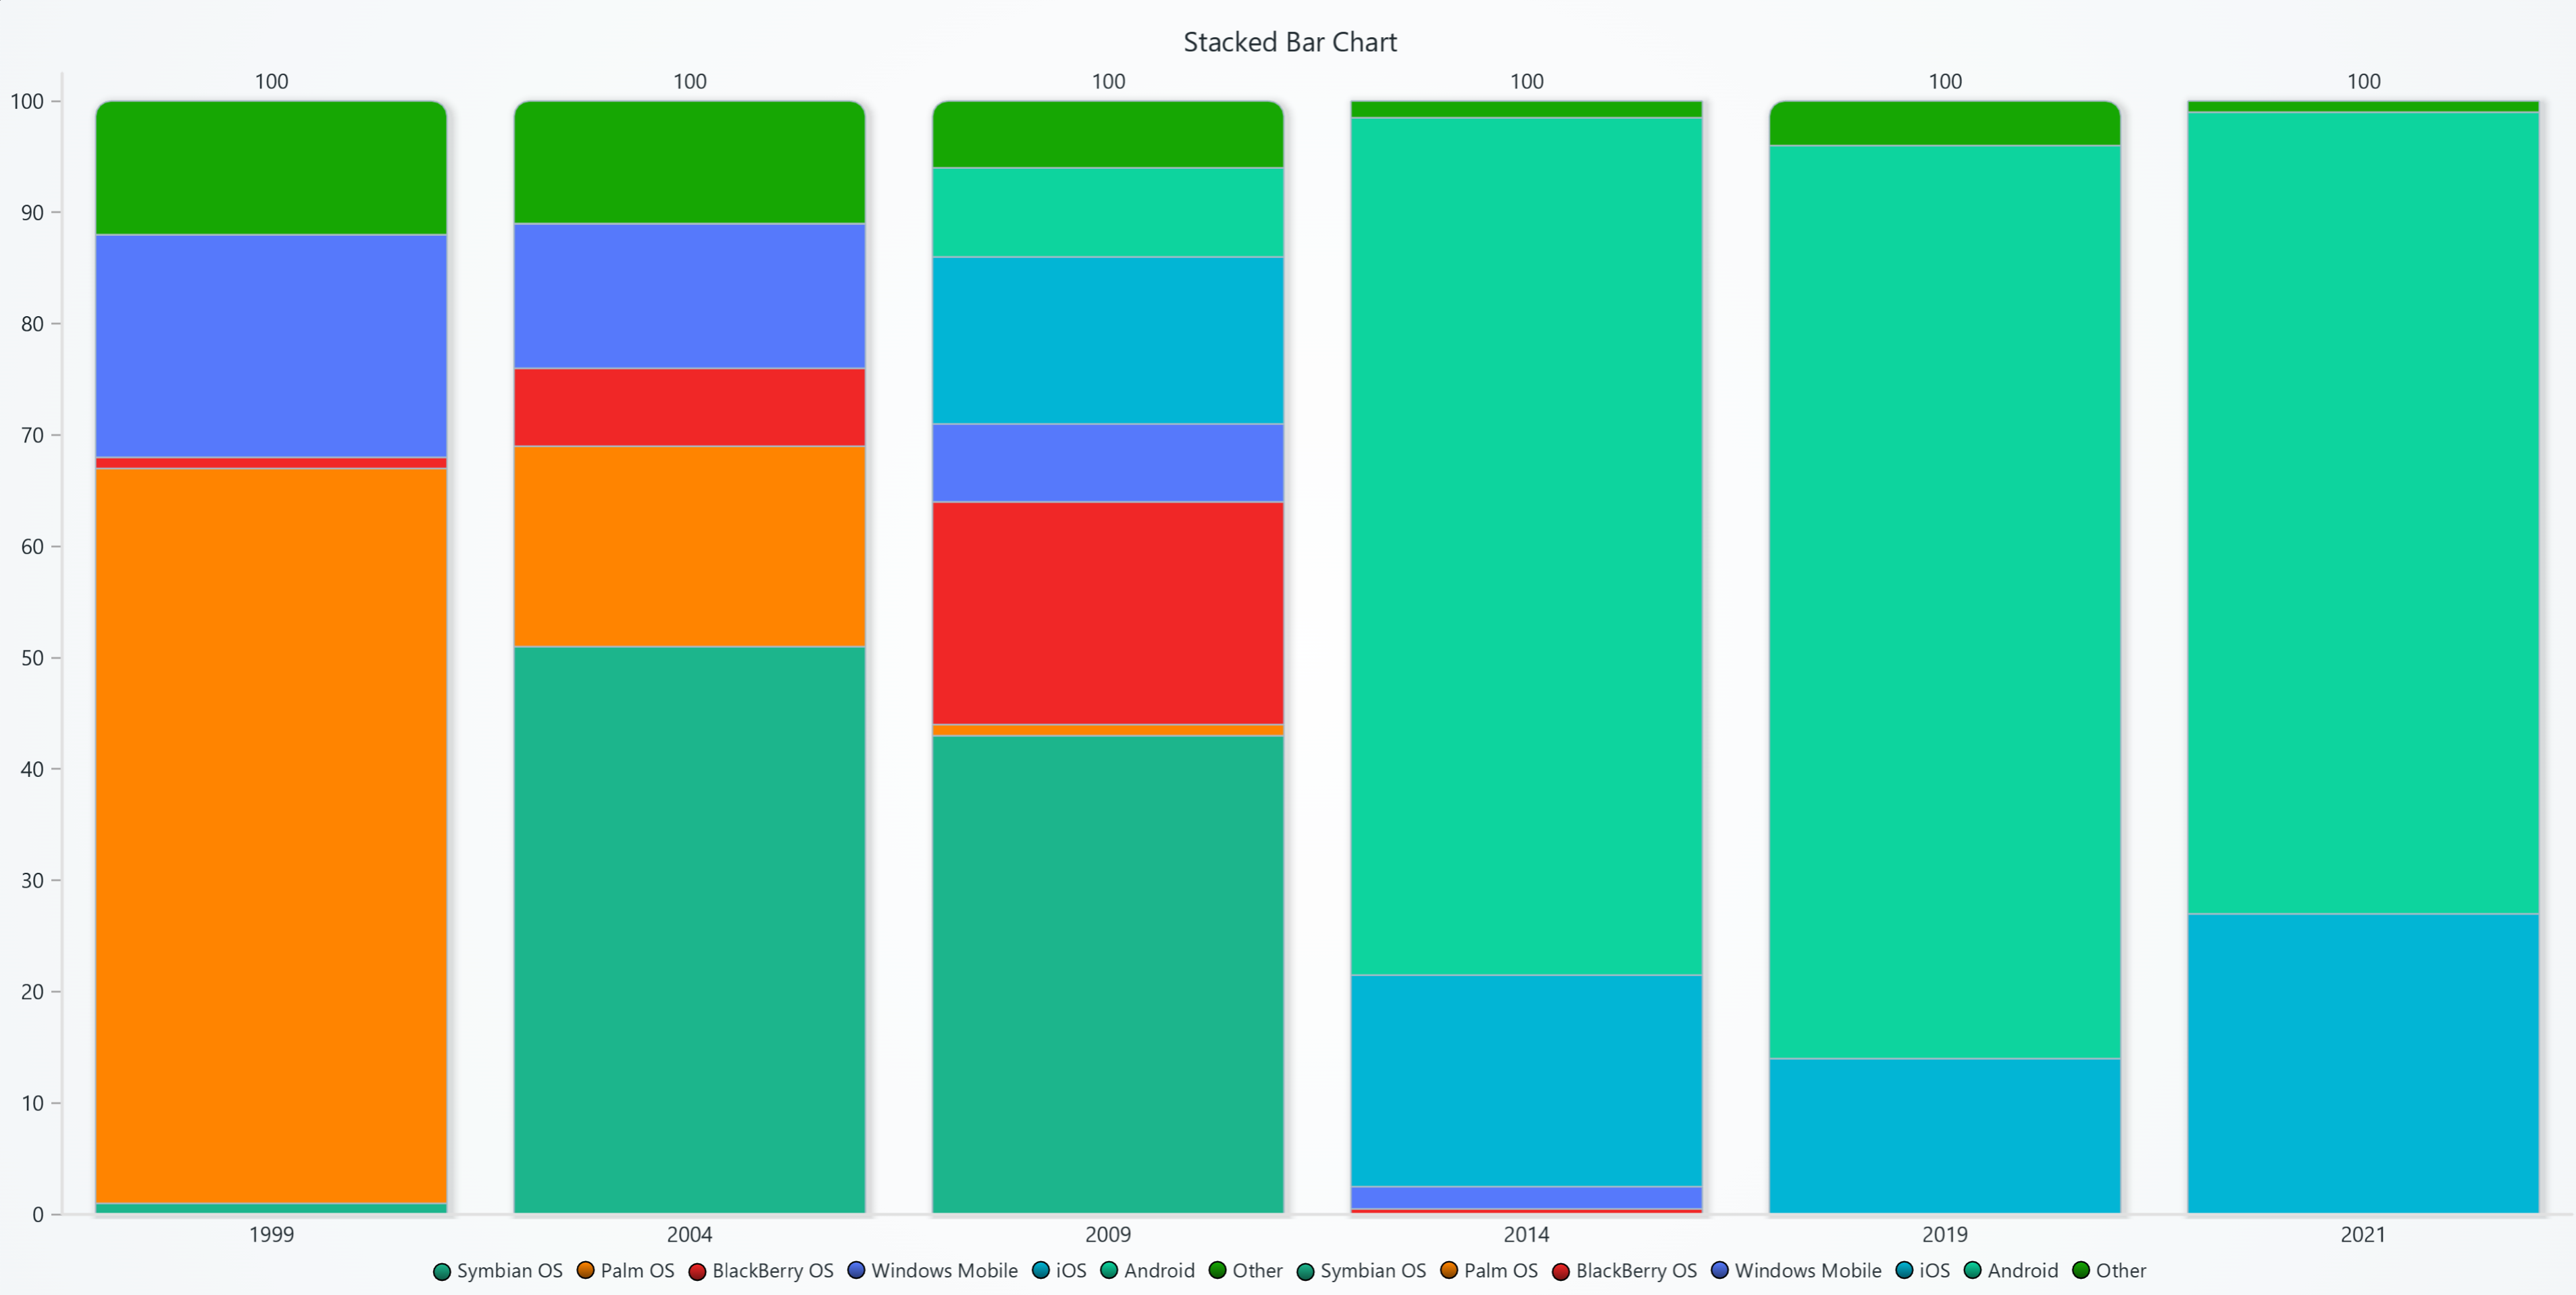
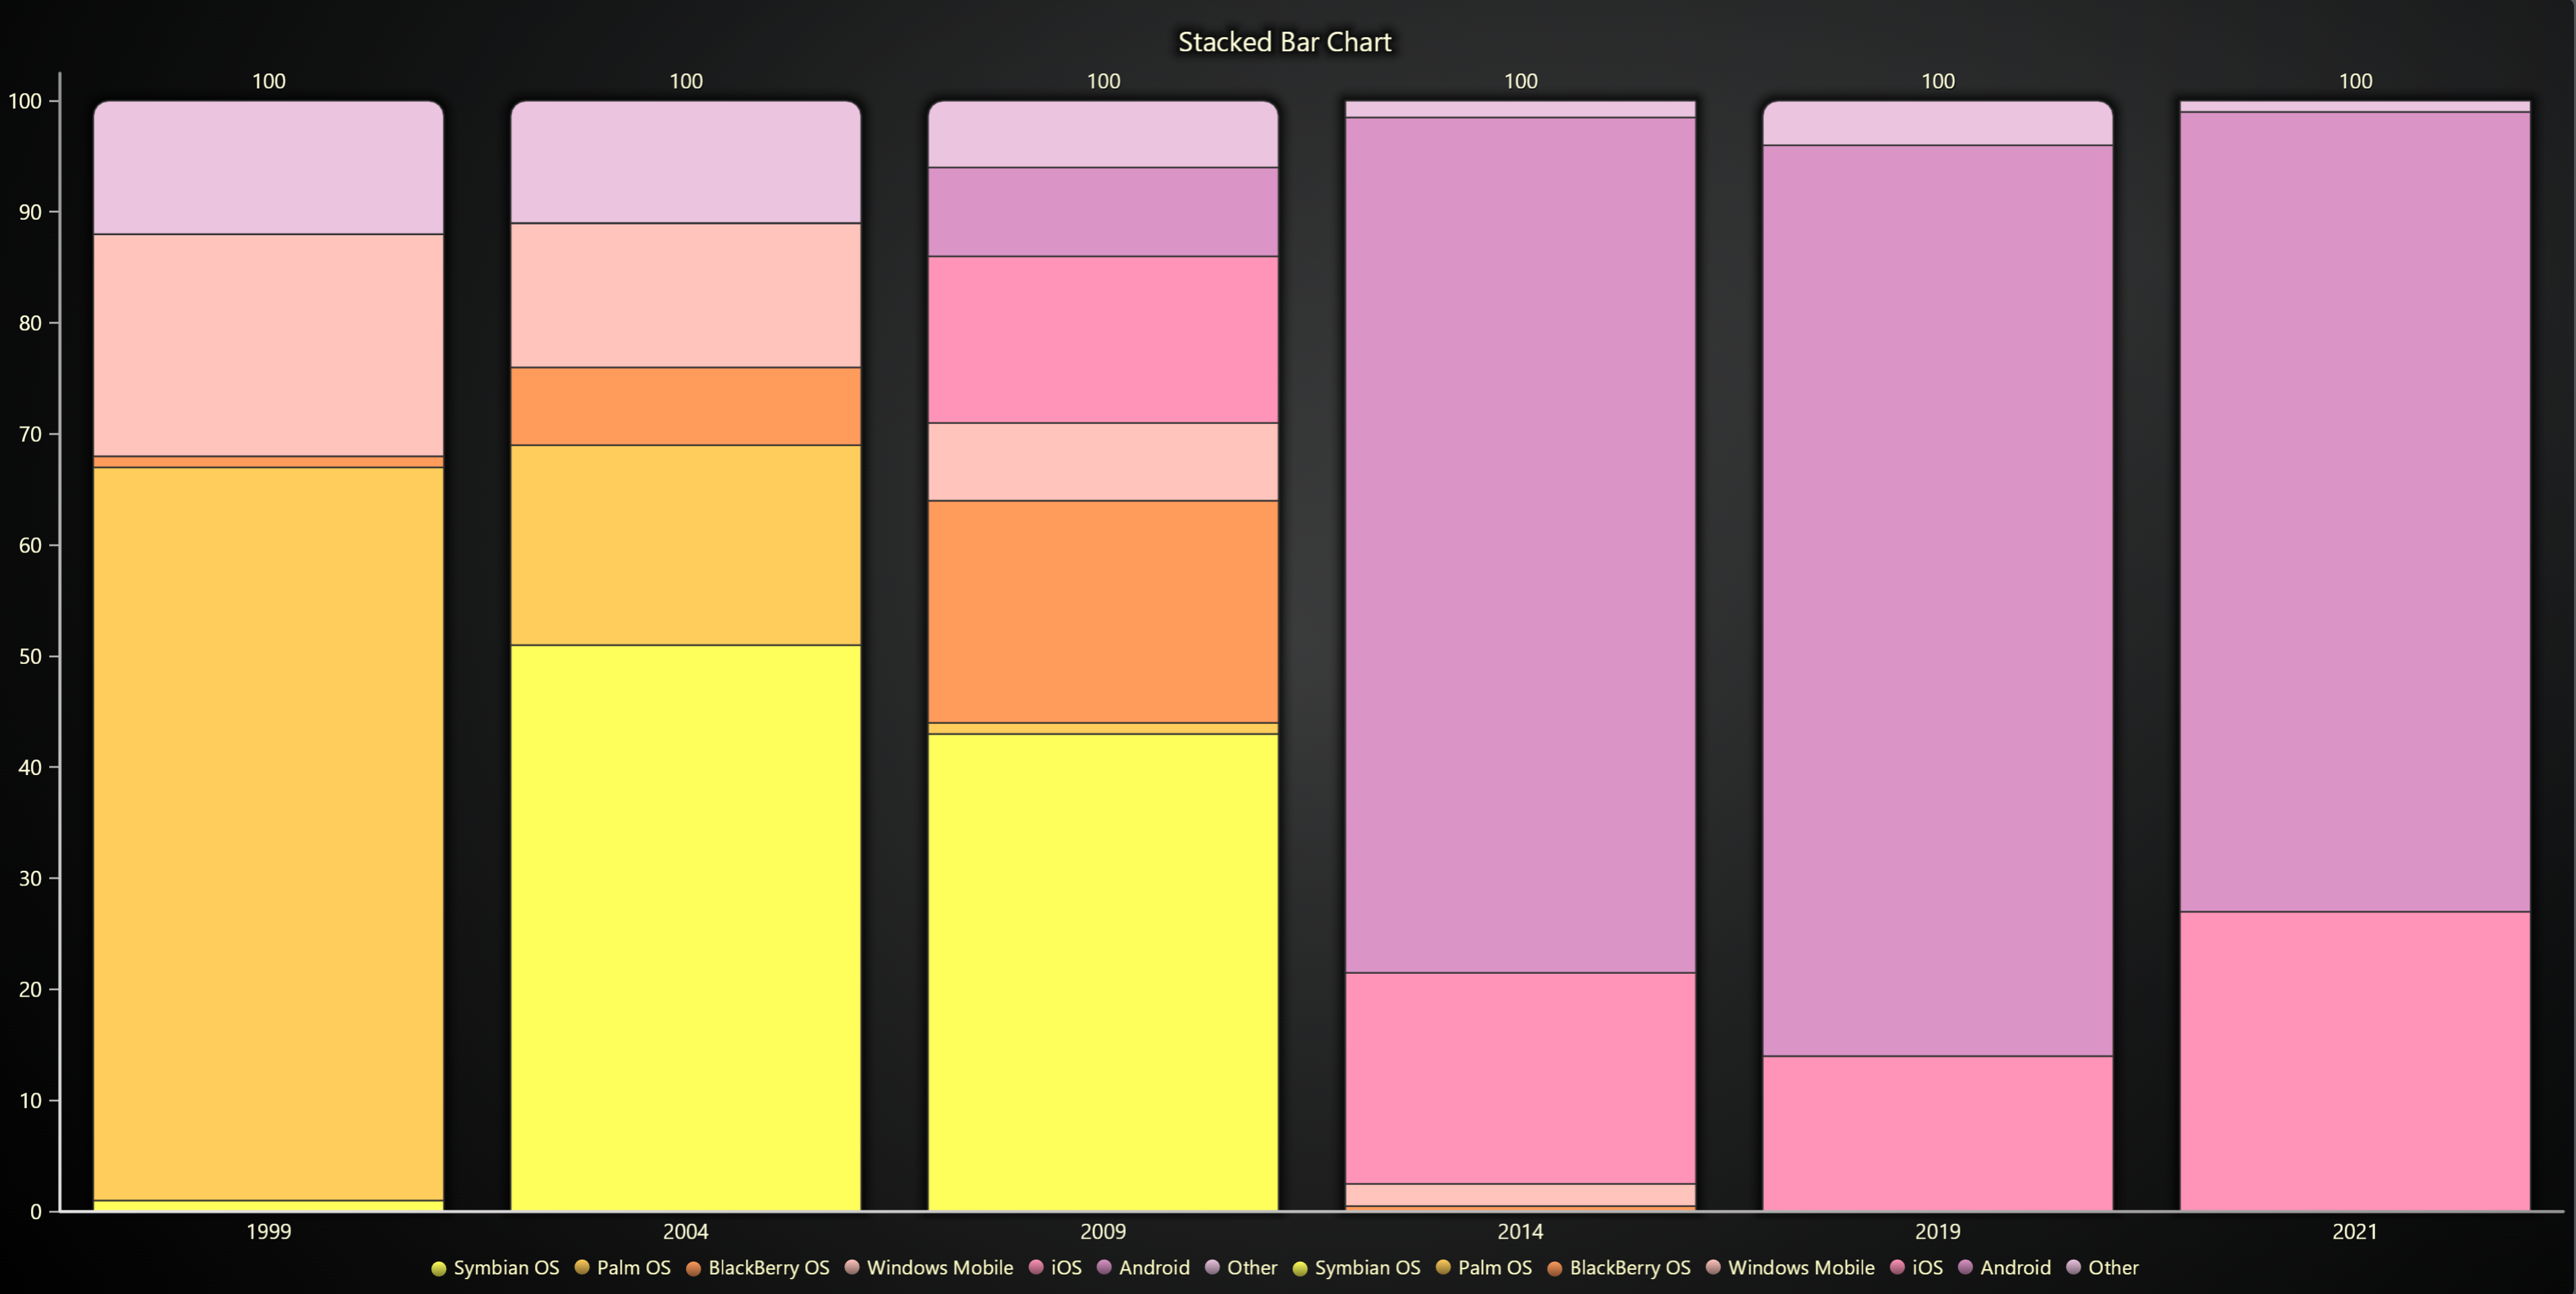
import lightningchart as lc

lc.set_license('my-license-key')

chart = lc.BarChart(
    vertical=True,
    theme=lc.Themes.Light,
    title='Stacked Bar Chart'
)
chart.set_data_stacked(
    ['1999', '2004', '2009', '2014', '2019', '2021'],
    [
        {'subCategory': 'Symbian OS', 'values': [1, 51, 43, 0, 0, 0]},
        {'subCategory': 'Palm OS', 'values': [66, 18, 1, 0, 0, 0]},
        {'subCategory': 'BlackBerry OS', 'values': [1, 7, 20, 0.5, 0, 0]},
        {'subCategory': 'Windows Mobile', 'values': [20, 13, 7, 2, 0, 0]},
        {'subCategory': 'iOS', 'values': [0, 0, 15, 19, 14, 27]},
        {'subCategory': 'Android', 'values': [0, 0, 8, 77, 82, 72]},
        {'subCategory': 'Other', 'values': [12, 11, 6, 1.5, 4, 1]},
    ],
)
chart.open()
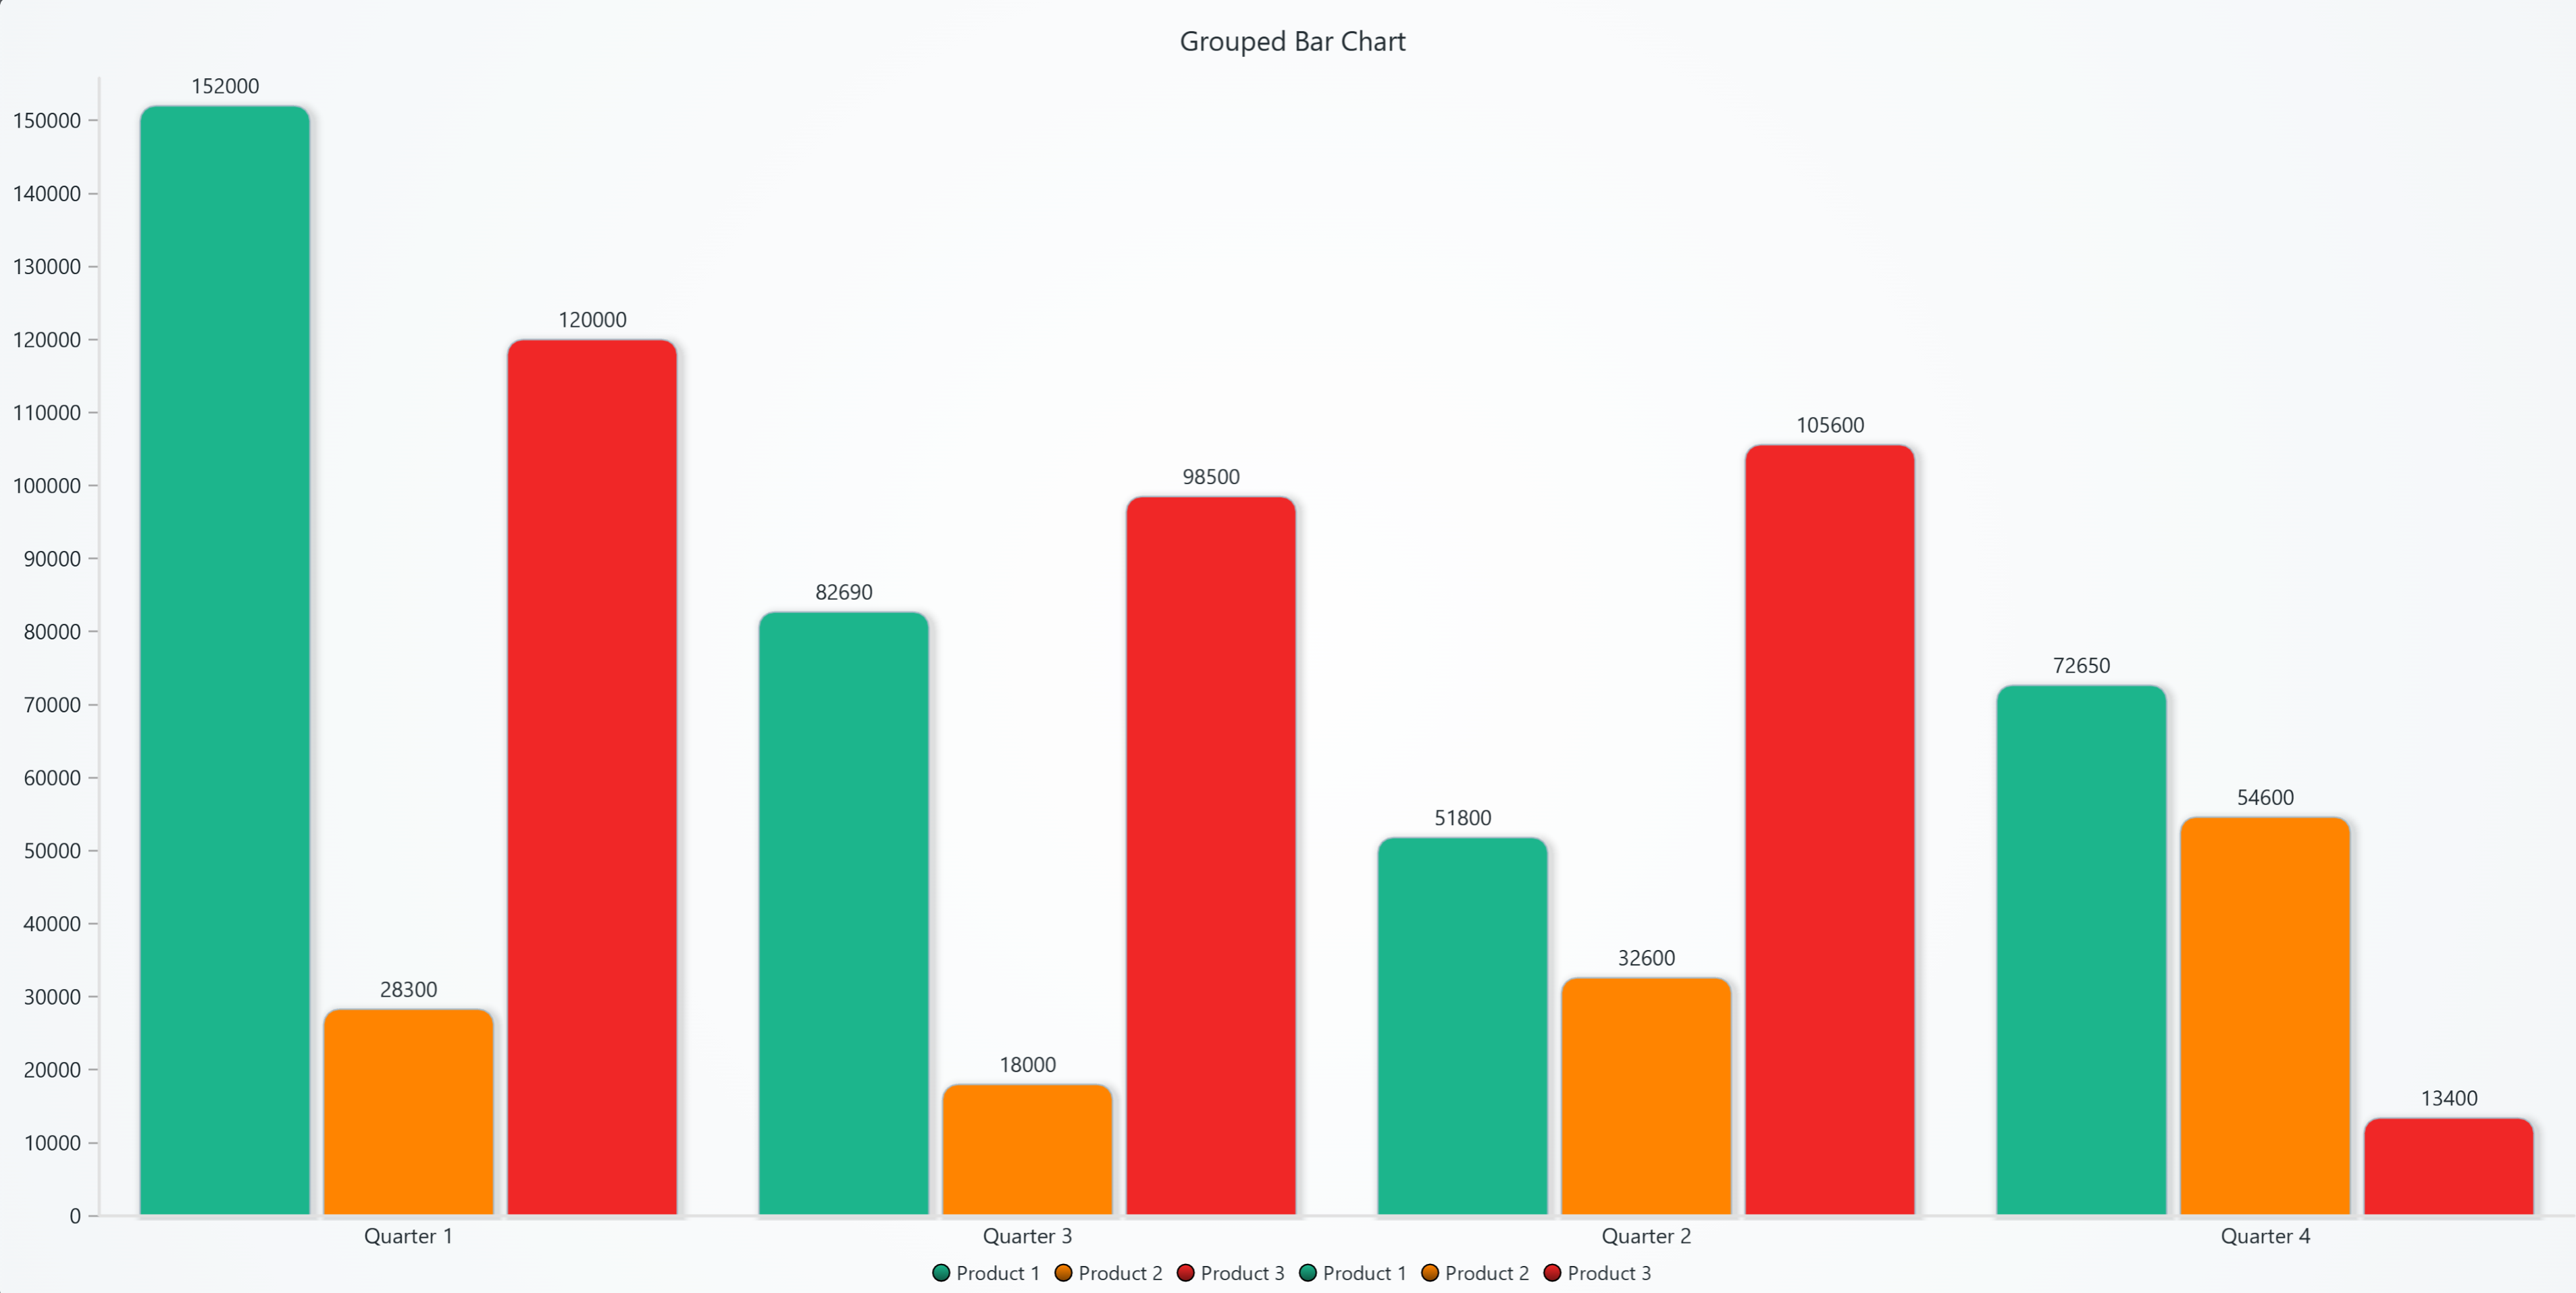
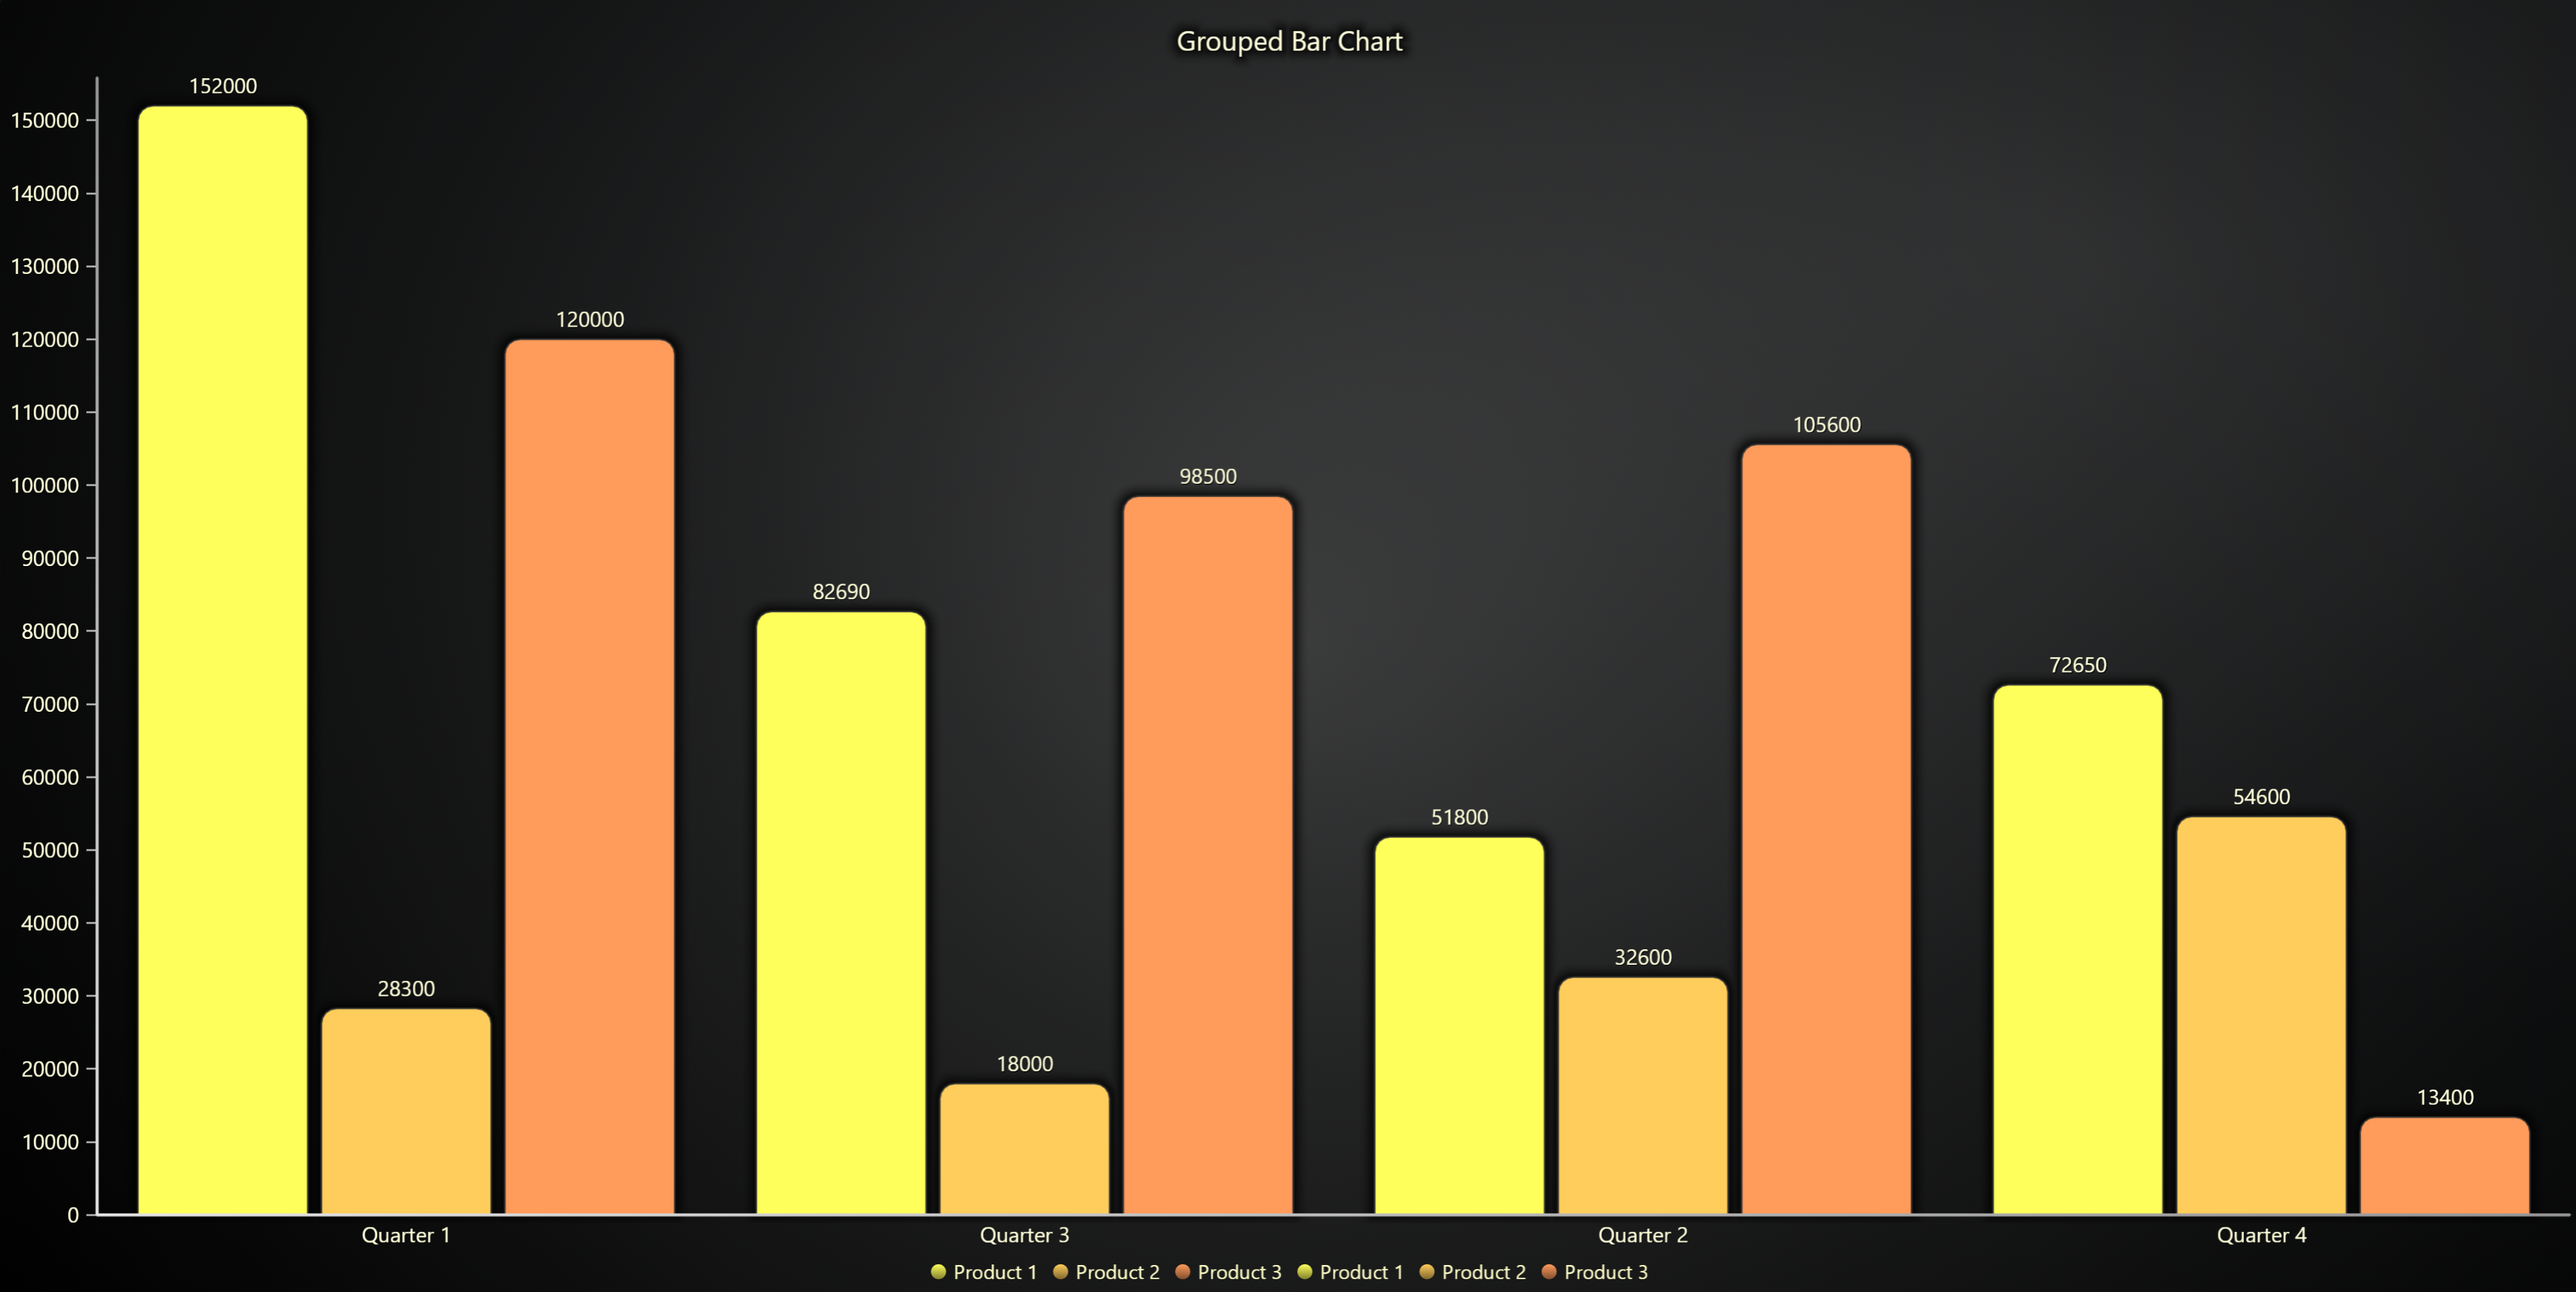
Grouped Bar Chart
import lightningchart as lc

lc.set_license('my-license-key')

chart = lc.BarChart(
    vertical=True,
    theme=lc.Themes.Light,
    title='Grouped Bar Chart'
)
chart.set_data_grouped(
    ['Quarter 1', 'Quarter 2', 'Quarter 3', 'Quarter 4'],
    [
        {'subCategory': 'Product 1', 'values': [152000, 51800, 82690, 72650]},
        {'subCategory': 'Product 2', 'values': [28300, 32600, 18000, 54600]},
        {'subCategory': 'Product 3', 'values': [120000, 105600, 98500, 13400]},
    ],
)

chart.open()
Histogram
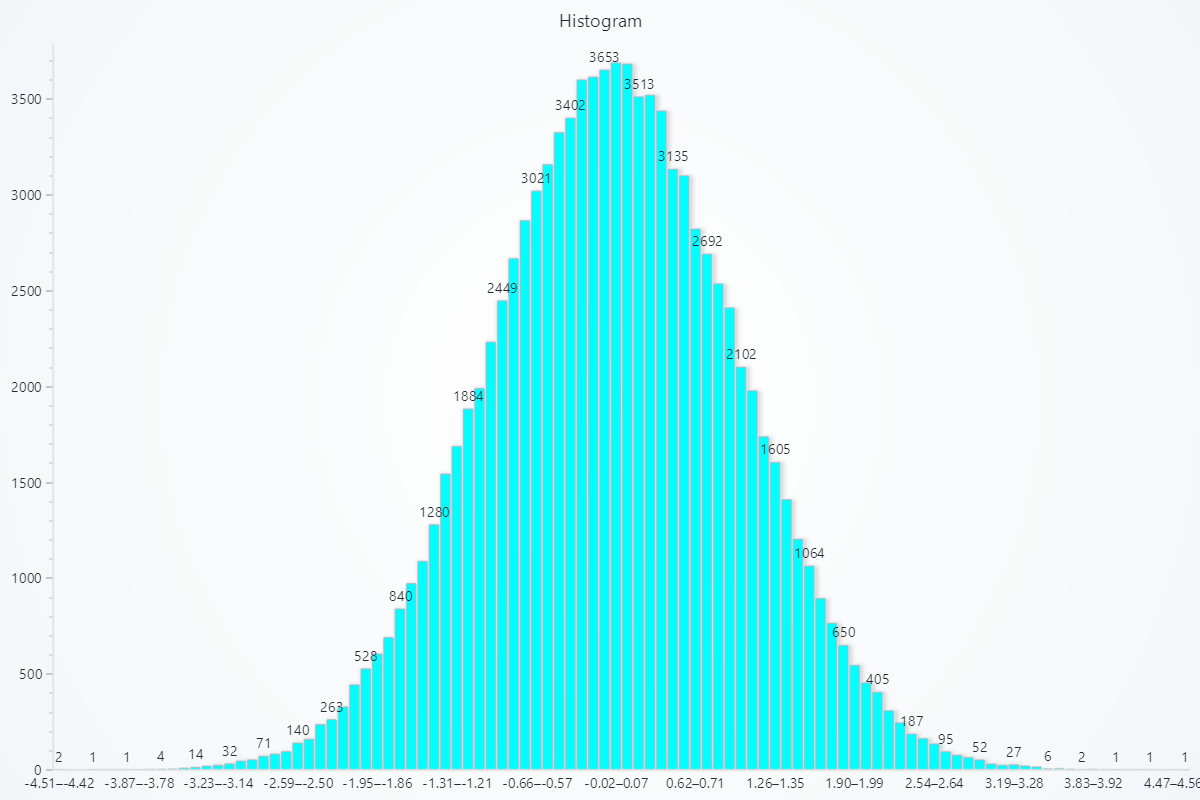
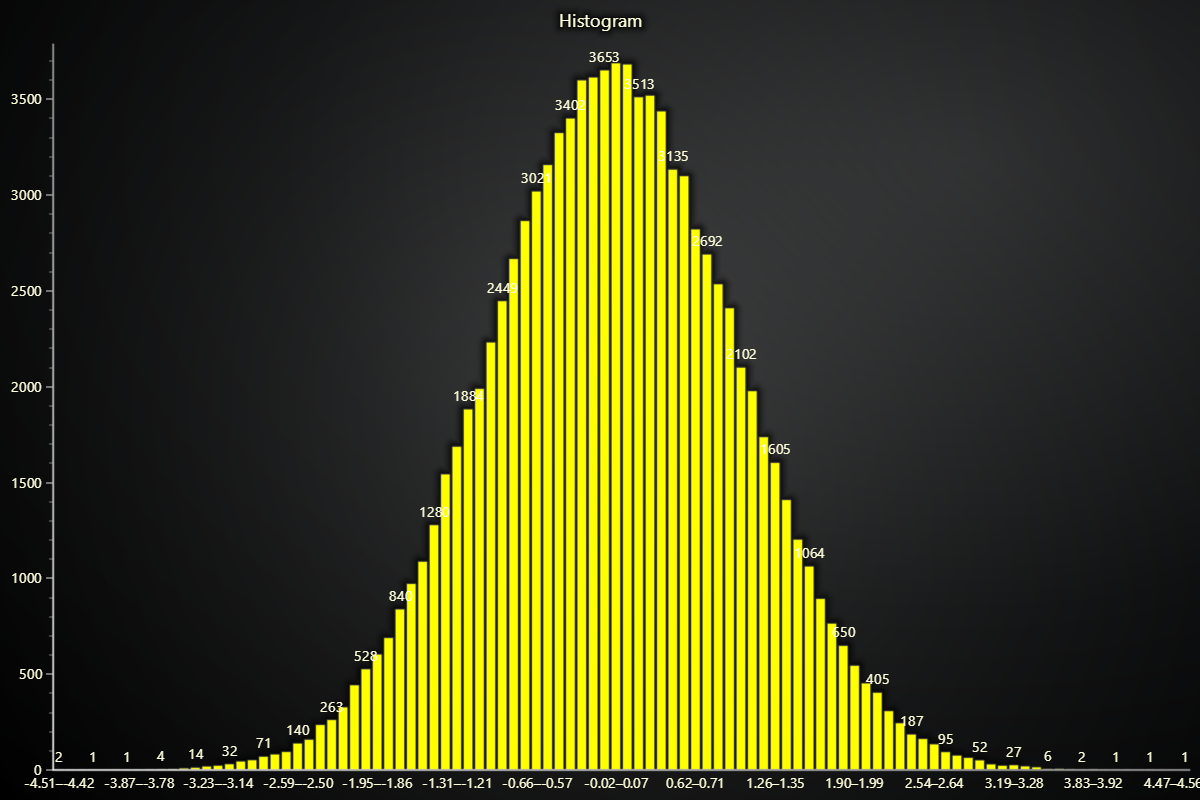
import numpy as np
import lightningchart as lc

# Set the license key
lc.set_license('my-license-key')

# Generate data for the histogram
data = np.random.normal(0, 1, 100000)

# Calculate histogram
counts, bin_edges = np.histogram(data, bins=100)

# Preparing data
bar_data = [
    {"category": f"{bin_edges[i]:.2f}–{bin_edges[i+1]:.2f}", "value": int(count)}
    for i, count in enumerate(counts)
]

# Create BarChart
chart = lc.BarChart(
    vertical=True,
    theme=lc.Themes.Light,
    title='Histogram',
    legend={
        'visible':False
    }
)

# Set the histogram data
chart.set_data(bar_data)

# Disable sorting to display bars in order
chart.set_sorting('disabled')

# Color the bars
chart.set_bars_color(('cyan'))

chart.open()