Parallel Coordinate Chart
import lightningchart as lc
import random
# Set your license key here
lc.set_license('my-license-key')
# Initialize the chart
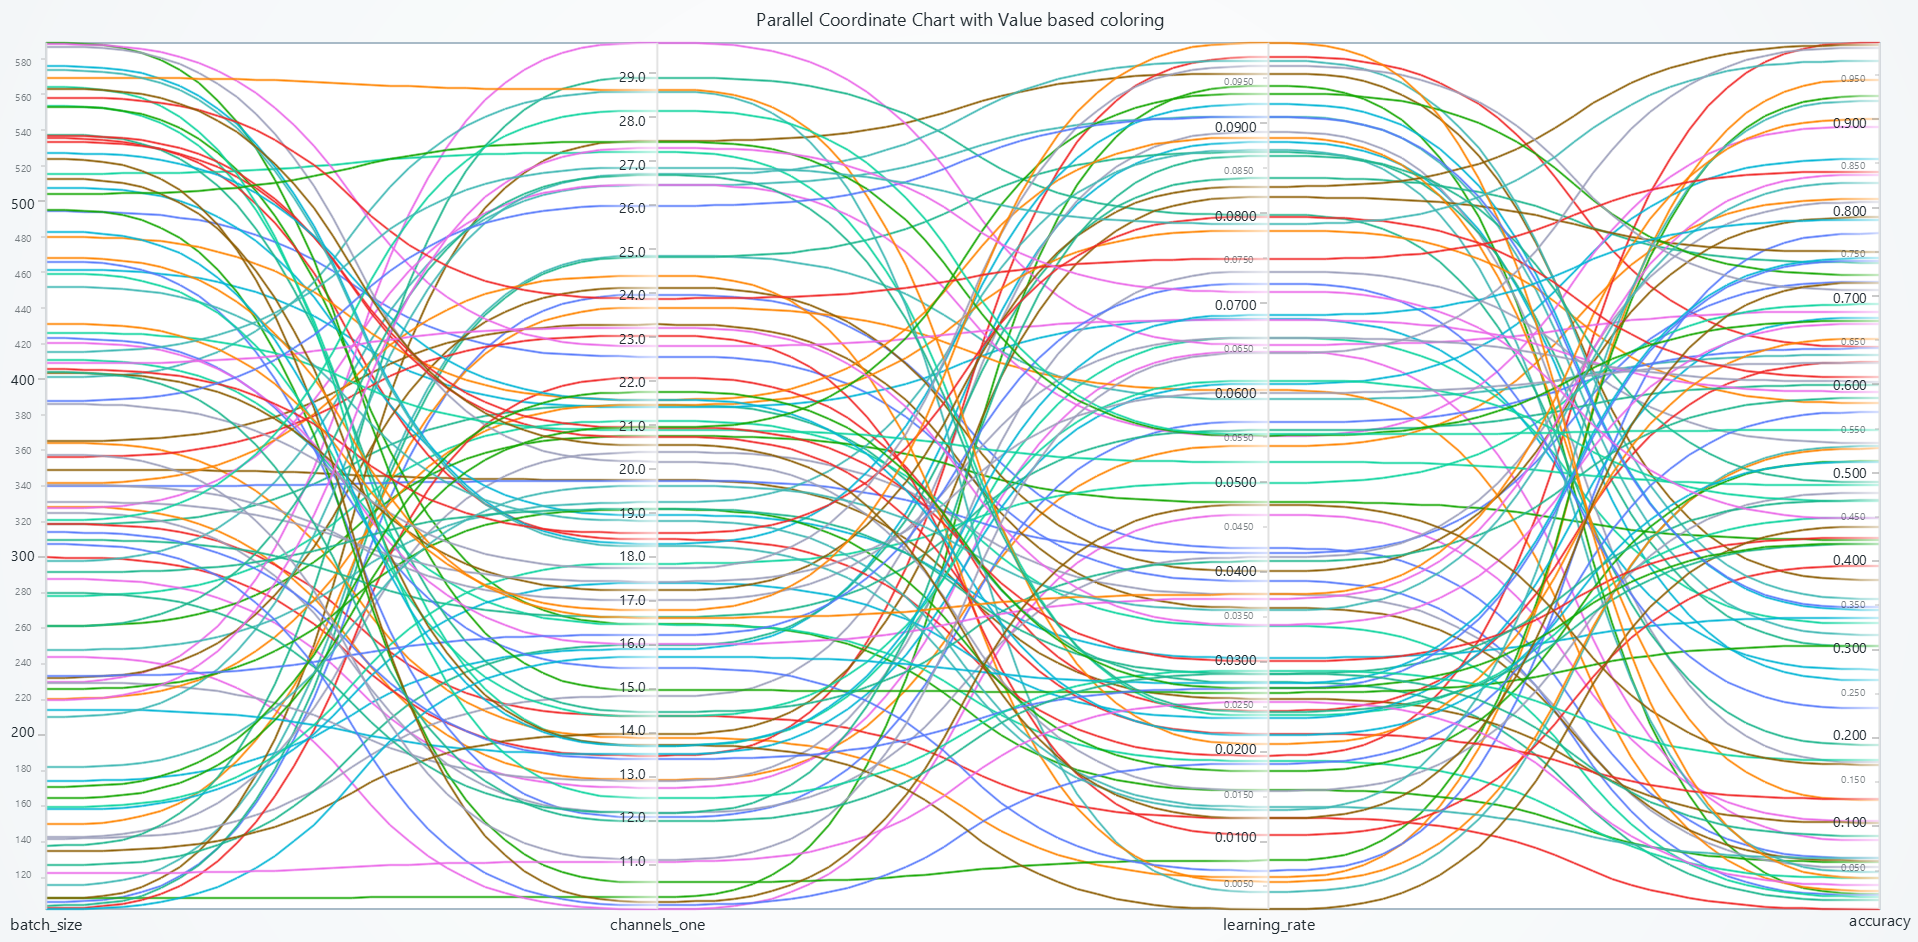
chart = lc.ParallelCoordinateChart(
theme=lc.Themes.Light,
title="Parallel Coordinate Chart with Value based coloring"
)
# Set axes and title
chart.set_axes(['batch_size', 'channels_one', 'learning_rate', 'accuracy'])
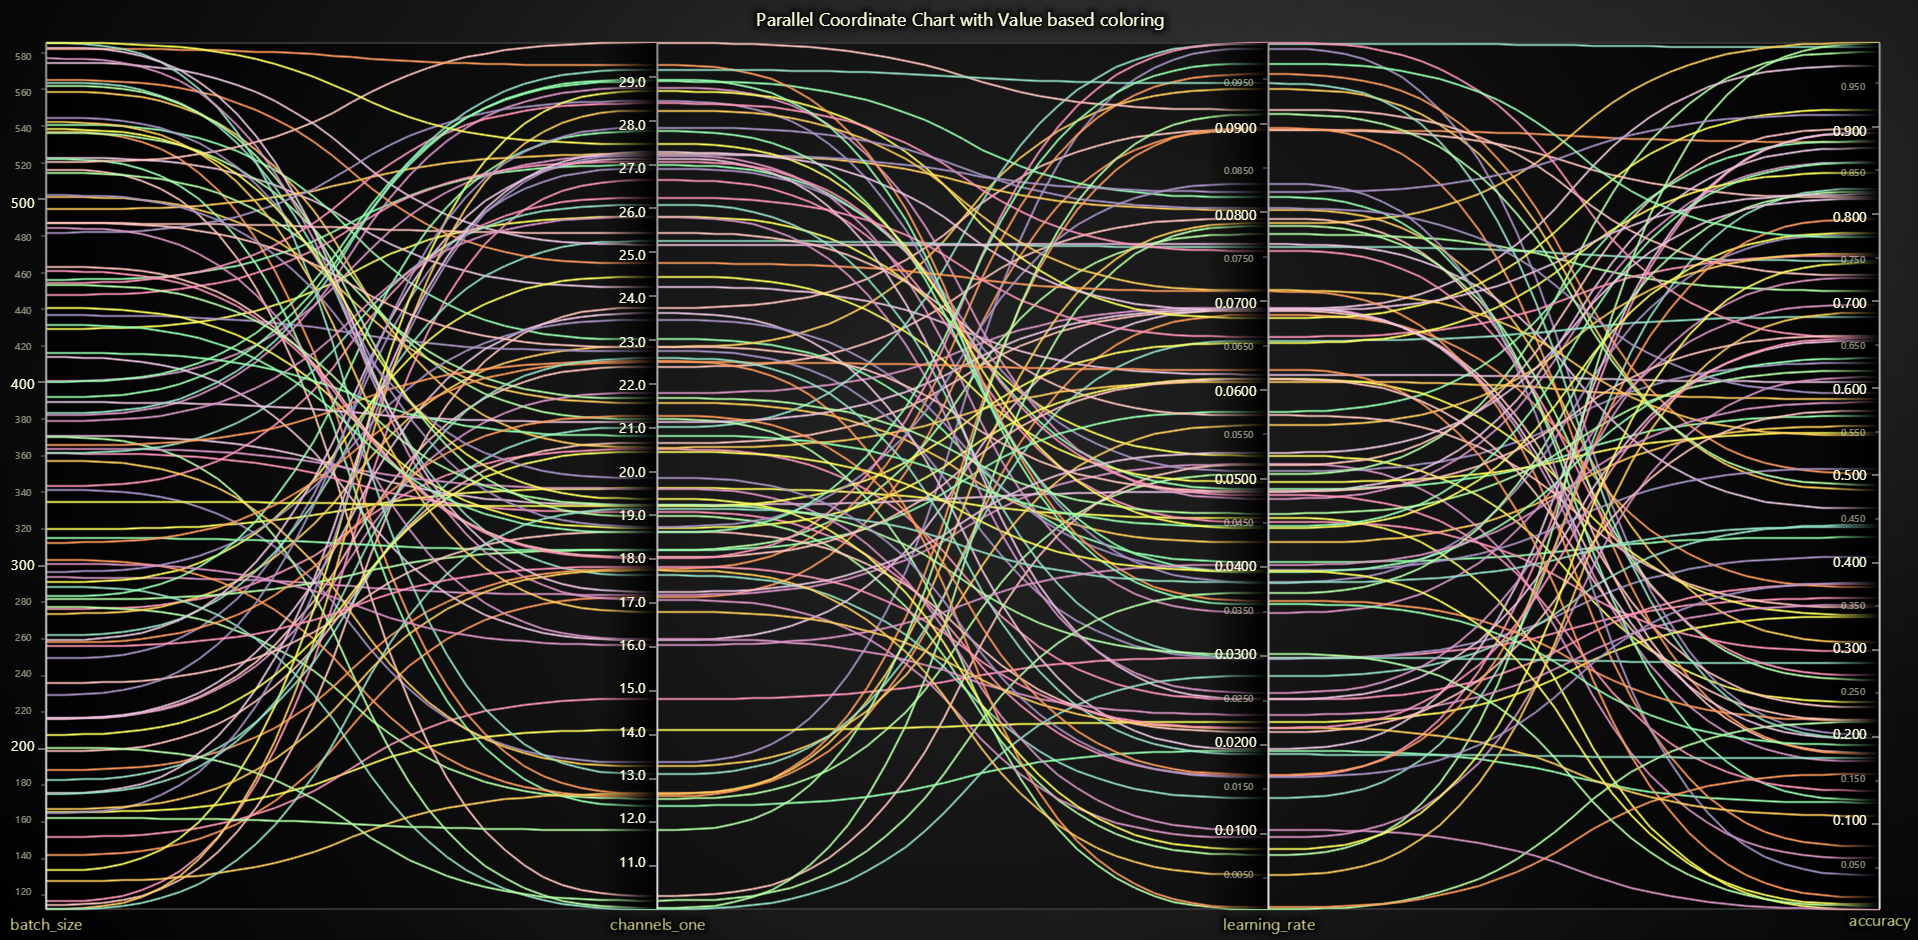
# Generating data and add them to series
for _ in range(100):
data = {
'batch_size': random.uniform(100, 600),
'channels_one': random.uniform(10, 30),
'learning_rate': random.uniform(0.001, 0.1),
'accuracy': random.uniform(0, 1)
}
series = chart.add_series()
series.set_data(data)
# Open the chart
chart.open()
import lightningchart as lc
from time import time, sleep
from random import random
import threading
# Set your license key here
lc.set_license('my-license-key')
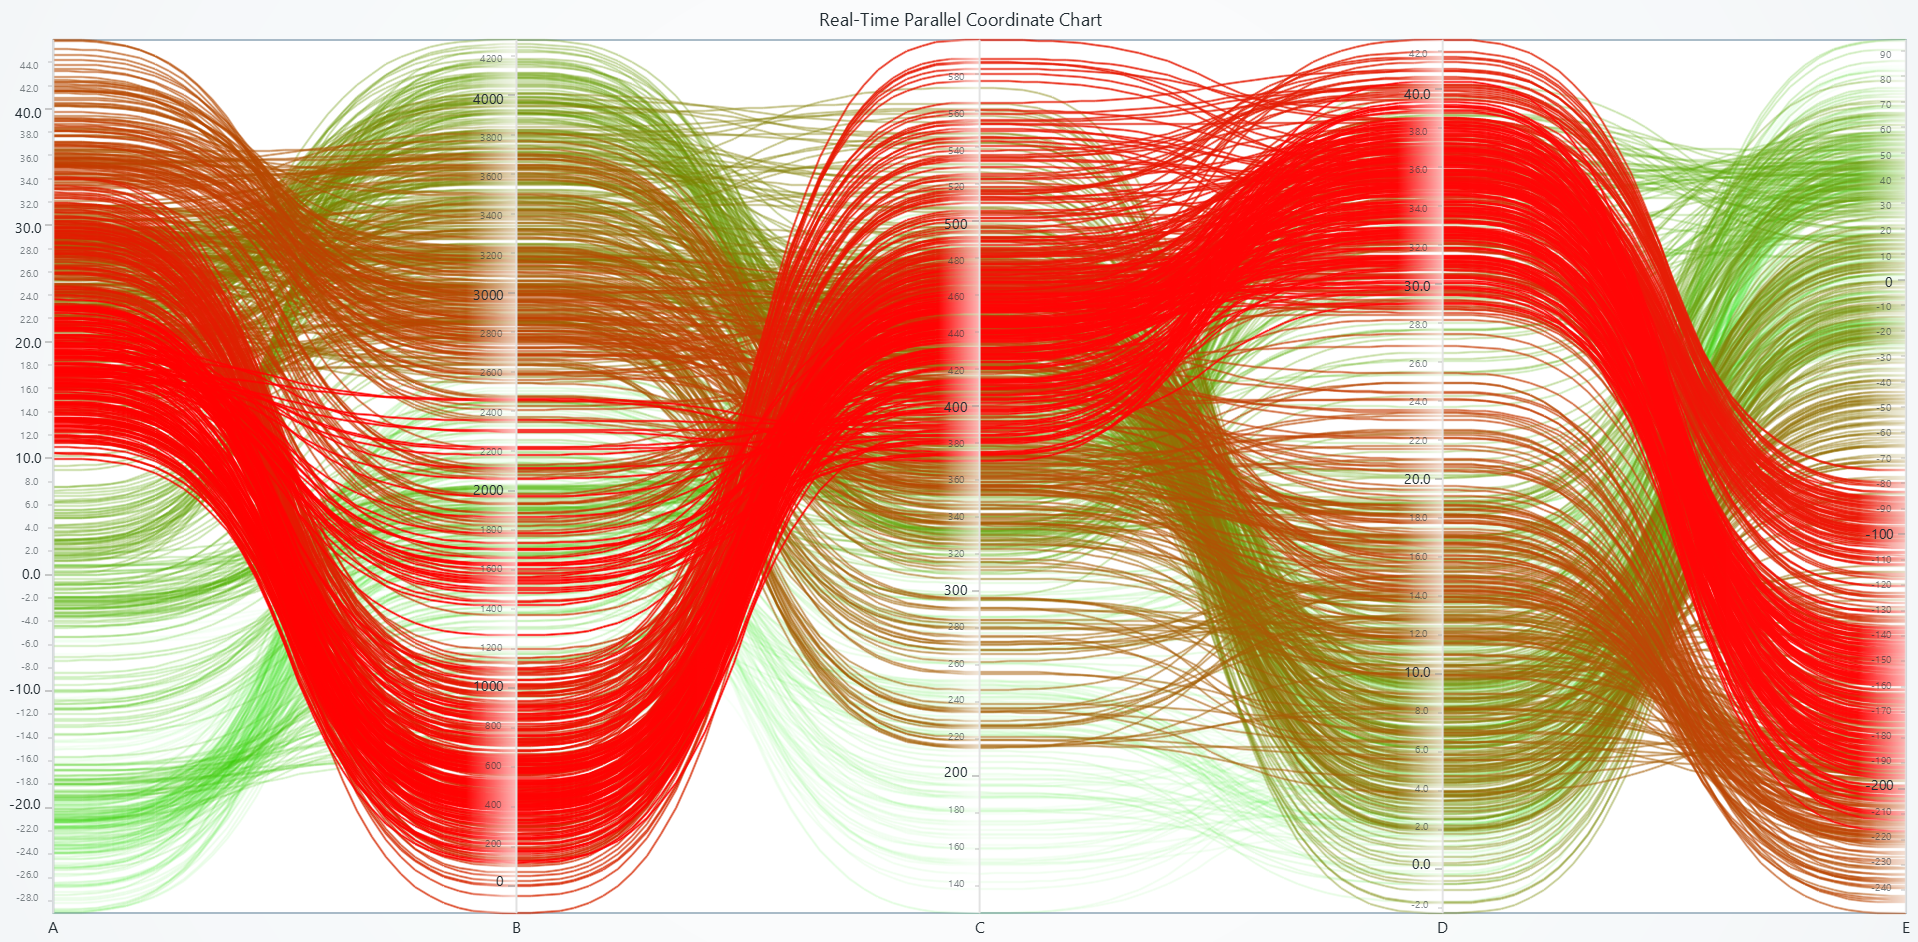
# Initialize a real-time parallel coordinate chart
chart = lc.ParallelCoordinateChart(
theme=lc.Themes.Light,
title="Real-Time Parallel Coordinate Chart"
)
# Set the title of the chart
chart.set_title("Real-Time Parallel Coordinate Chart")
# Define the axes for the chart
chart.set_axes(['Time', 'A', 'B', 'C', 'D', 'E'])
# Enable spline interpolation for smoother transitions between data points
chart.set_spline(True)
# Configure axes to fit dynamically as new data is added
for axis_key in ['Time', 'A', 'B', 'C', 'D', 'E']:
chart.get_axis(axis_key).set_scroll_strategy("fitting")
# Hide the "Time" axis for cleaner visualization
chart.get_axis("Time").set_visible(False)
# Generate random data
def random_data_generator(start, multiplier):
previous = start
def generate():
nonlocal previous
y = previous + (random() * 2 - 1) * multiplier
previous = y
return y
return generate
# Initialize random data generators for each variable
Y0 = random_data_generator(0, 2)
Y1 = random_data_generator(1000, 200)
Y2 = random_data_generator(100, 20)
Y3 = random_data_generator(10, 2)
Y4 = random_data_generator(80, 10)
# Track the last time data cleaning was performed
t_last_cleanup = time() - 10
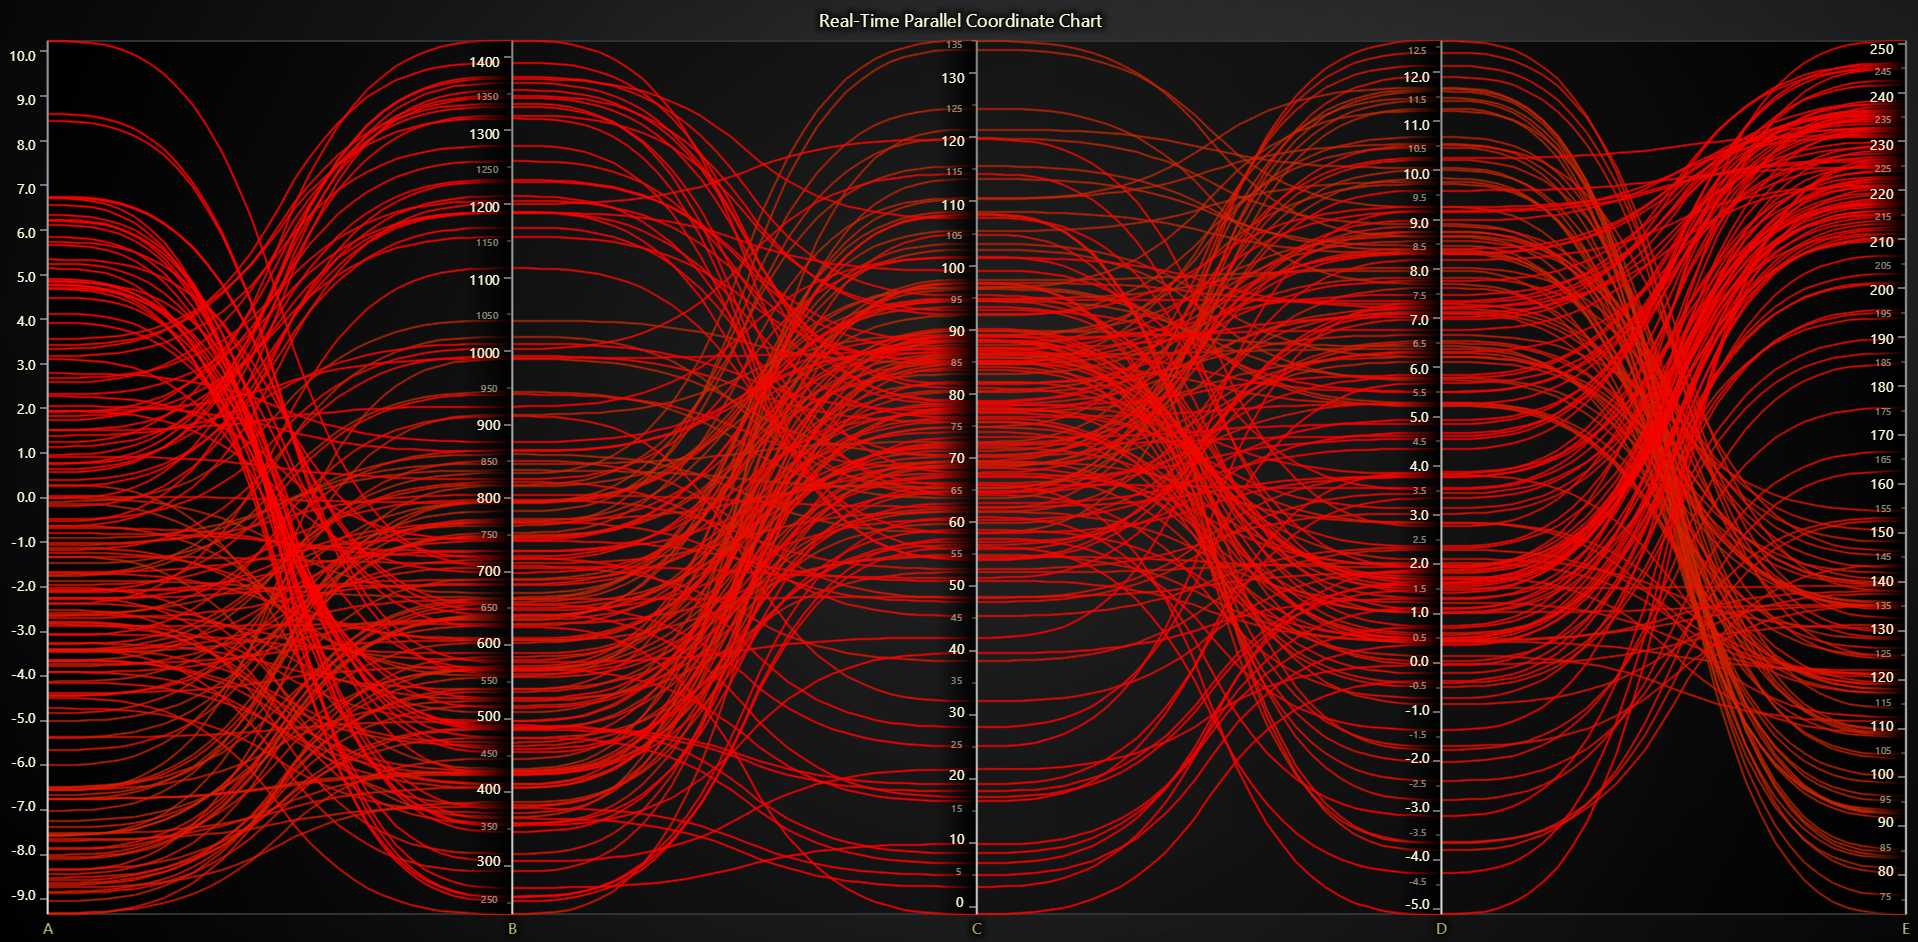
# Function to generate gradient steps for color mapping based on time
def generate_gradient_steps(start_time, end_time, steps_count=10):
gradient_steps = []
for i in range(steps_count):
ratio = i / (steps_count - 1)
color = (
int(255 * ratio), # Red by increasing ratio
int(255 * (1 - ratio)), # Green by decreasing ratio
0,
int(255 * ratio)
)
step_value = start_time + (end_time - start_time) * ratio
gradient_steps.append({'value': step_value, 'color': color})
return gradient_steps
# Function to continuously update the chart with new data
def update_chart():
global t_last_cleanup
while True:
t_now = time() * 1000
y0 = Y0()
y1 = Y1()
y2 = Y2()
y3 = Y3()
y4 = Y4()
# Add a new series (data point) to the char
series = chart.add_series()
series.set_data({
'Time': t_now,
'A': y0,
'B': y1,
'C': y2,
'D': y3,
'E': y4,
})
# Cleaning data every 5 seconds
if (t_now - t_last_cleanup) >= 5000:
# Remove series which are older than 1 minute
for s in chart.get_series():
data = s.get_data()
timestamp = data.get('Time') if data else None
if timestamp and (t_now - timestamp) >= 60000:
s.dispose()
# Apply colors
gradient_steps = generate_gradient_steps(t_now - 60000, t_now)
chart.set_lut(
axis_key="Time",
interpolate=True,
steps=gradient_steps
)
t_last_cleanup = t_now
# Wait briefly before adding the next data point
sleep(0.05)
# Start a separate thread to update the chart in real-time
thread = threading.Thread(target=update_chart)
thread.daemon = True
thread.start()
# Open the chart in live mode
chart.open(live=True)