Real-time data
Visualizing real-time data with LightningChart Python is extremely simple. The only practical differences from the static display mode are:
- Chart must be opened with the parameter
live=True - Real-time updates must be applied after the chart has been opened
- Chart must be closed manually by
chart.close()
import lightningchart as lc
import random
import time

lc.set_license('my-license-key')

chart = lc.ChartXY(title='Real-time scatter chart', theme=lc.Themes.Light)
chart.set_animations_enabled(False)
series = chart.add_point_series()
chart.get_default_x_axis().set_interval(0, 100, stop_axis_after=True)
chart.get_default_y_axis().set_interval(0, 100, stop_axis_after=True)

chart.open(live=True) # open the live chart

# Here you would fetch the real-time data and append it to the chart
# For demonstration purposes random scatter data is generated
for i in range(1000):
    x = random.uniform(0, 100)
    y = random.uniform(0, 100)
    series.add(x, y)
    time.sleep(0.01) # simulate latency for demonstration purposes

chart.close() # close the live chart
Scrolling charts
Many real-time data visualization use cases require the axis of the chart to scroll to account for the new data points.
To enable this, the desired axis' scroll strategy must be set to scrolling.
It is also recommended to configure appropriate axis interval (start and end points) with stop_axis_after=False to allow continuous scrolling.
Scrolling line chart
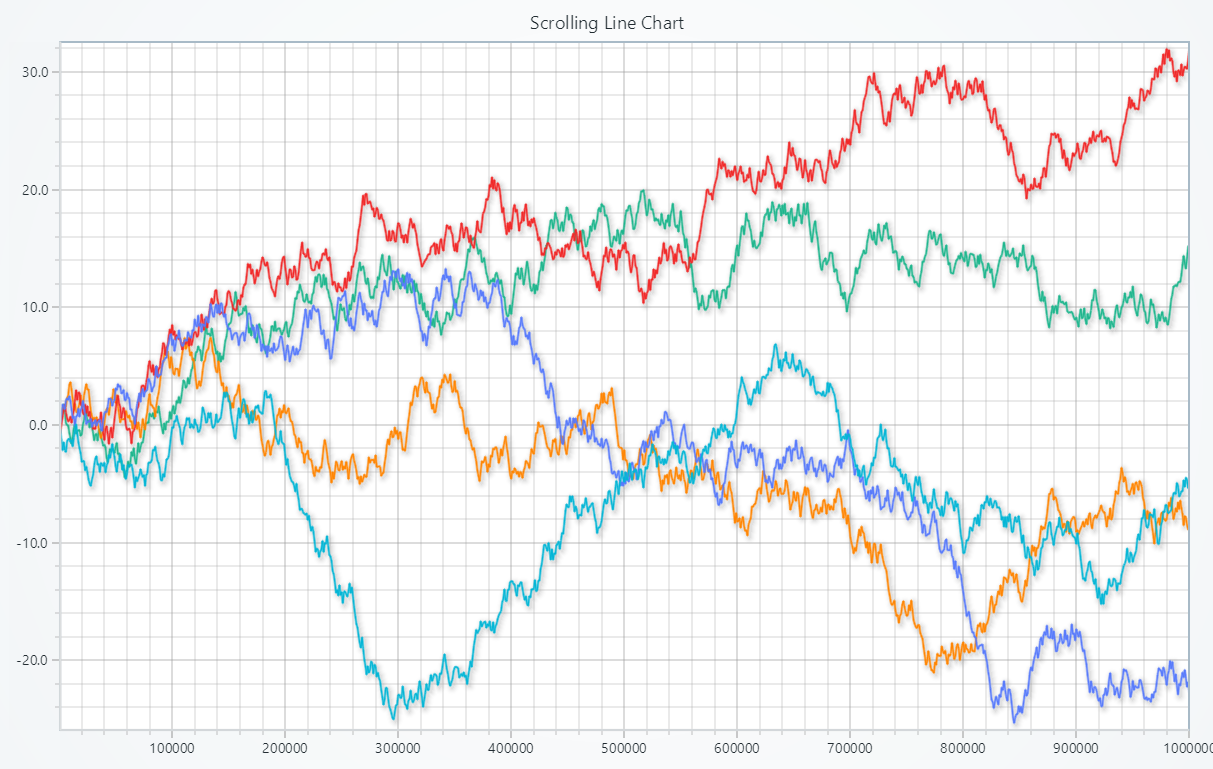
import lightningchart as lc
import time
import random

lc.set_license('my-license-key')

series_list = []
series_amount = 5

chart = lc.ChartXY(title='Scrolling Line Chart', theme=lc.Themes.Light)
for i in range(series_amount):
    # Add line series with progressive x-axis
    series_list.append(chart.add_line_series(
        schema={
            'x': {'pattern': 'progressive'},
            'y': {'pattern': None},
            }))

# Get the default x-axis reference
axis_x = chart.get_default_x_axis()
# Apply the scroll strategy
axis_x.set_scroll_strategy(strategy='scrolling')
# Set the axis interval and allow it to scroll
axis_x.set_interval(start=-100000, end=0, stop_axis_after=False)

chart.open(live=True)

x = 0
y = []
for i in range(series_amount):
    y.append(0)

for _ in range(1000): # Generate random real-time data
    x += 1
    for i in range(series_amount):
        y[i] = y[i] + (random.random() * 2) - 1
        series_list[i].append_samples(samples={
            'x': [x * 1000],
            'y': [y[i]]
        })
    time.sleep(0.01)

chart.close()