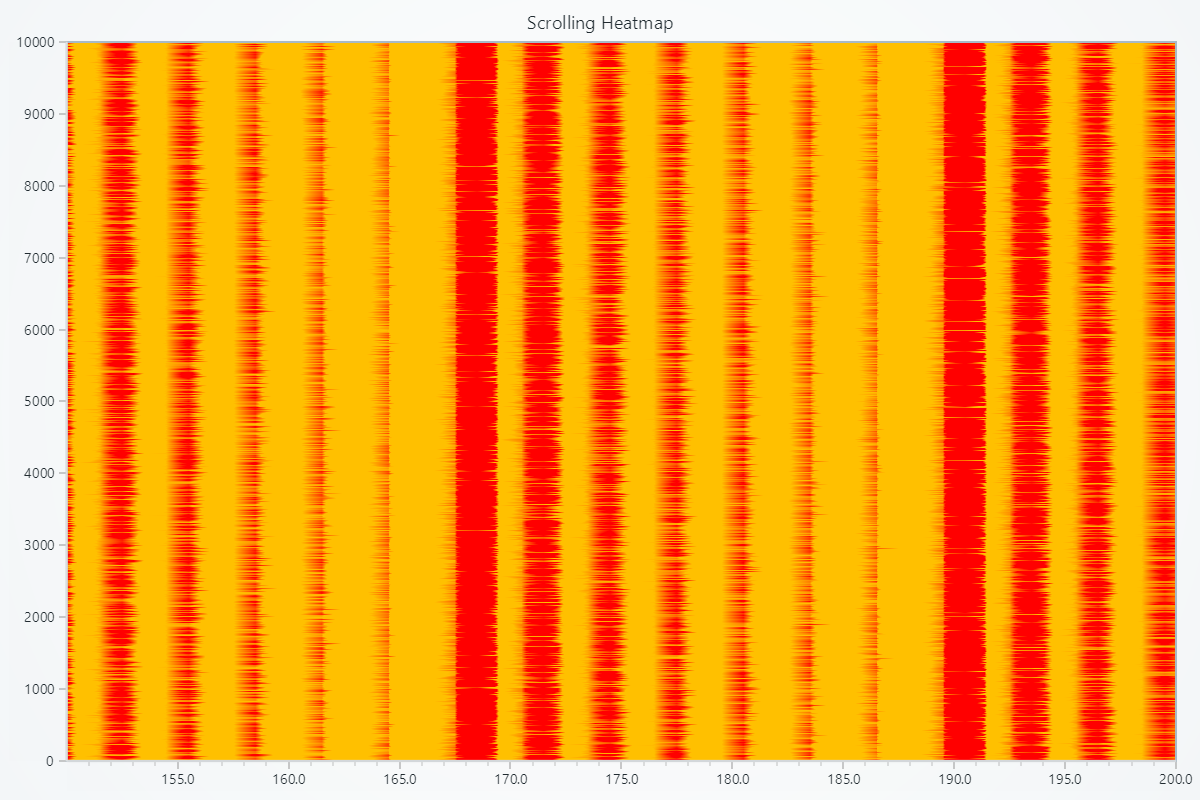
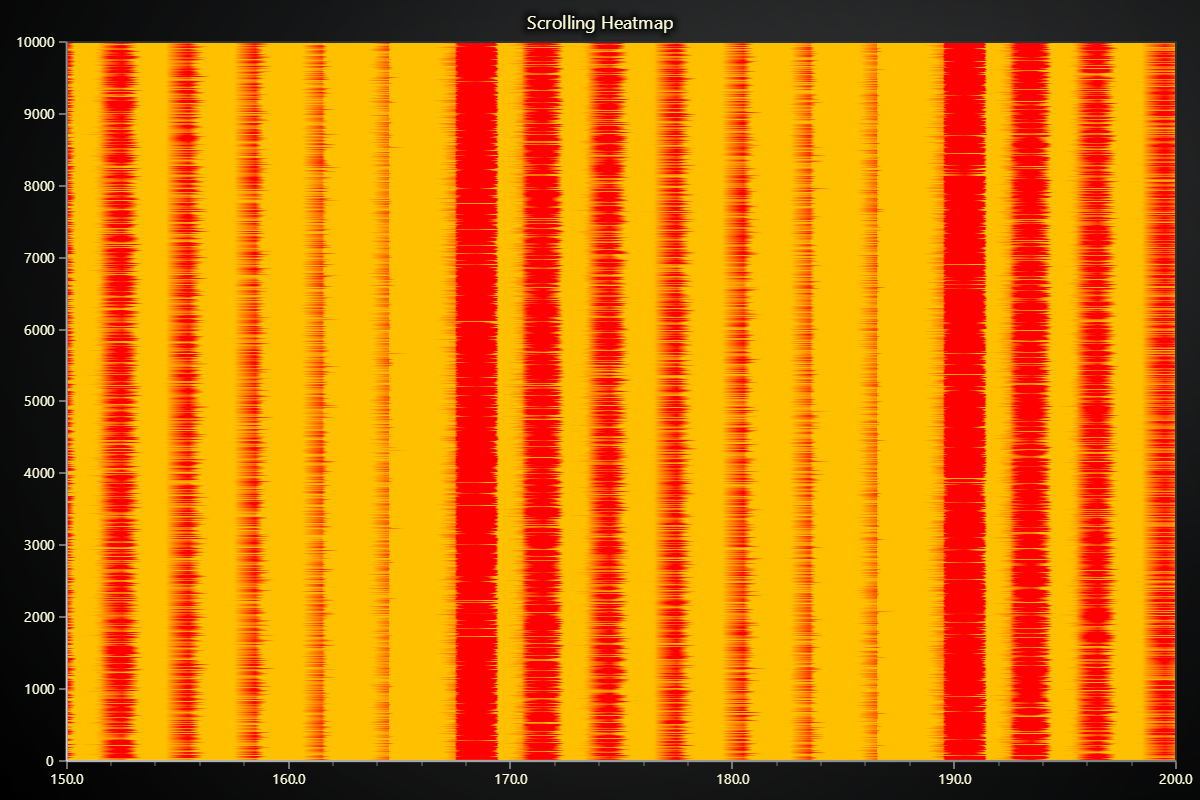
Scrolling Heatmap
import lightningchart as lc
import random
import math
import time

lc.set_license('my-license-key')

chart = lc.ChartXY(
    title='Scrolling Heatmap',
    theme=lc.Themes.Light
)

# Configure scrolling axis
axis = chart.get_default_x_axis()
axis.set_scroll_strategy(progressive=True)
axis.set_interval(start=-50, end=0, stop_axis_after=False)

# Configure scrolling heatmap series
heatmap = chart.add_heatmap_scrolling_grid_series(
    resolution=10000,
    scroll_dimension='columns',
)
heatmap.set_start(0, 0)
heatmap.set_step(1, 1)
heatmap.hide_wireframe()
heatmap.enable_data_cleaning(True)

# Configure heatmap coloring
heatmap.set_palette_coloring(
    steps=[
        {'value': 0, 'color': (255, 192, 0)},
        {'value': 100, 'color': (255, 0, 0)},
    ],
    look_up_property='value',
    percentage_values=False
)

chart.open(live=True)

# Generate random real-time data
for i in range(500):
    data = [[math.tan(i) * random.randint(0, 100) for j in range(10000)]]
    heatmap.add_intensity_values(data)  # Add values to the series
    time.sleep(0.05)

chart.close()
import lightningchart as lc
import numpy as np
import time
import random
# Set your LightningChart license key
lc.set_license('my-license-key')
resolution = 500 # Frequency resolution
time_window = 500 # Time axis window size
freq_idx = np.arange(resolution)
# Simulated data array for frequencies
def generate_spectrogram_column(t):
return [
np.sin(i / 10 + t * 0.02) * 50 +
np.cos(t / 20) * 30 +
random.uniform(-20, 20)
for i in range(resolution)
]
# Initializing the chart
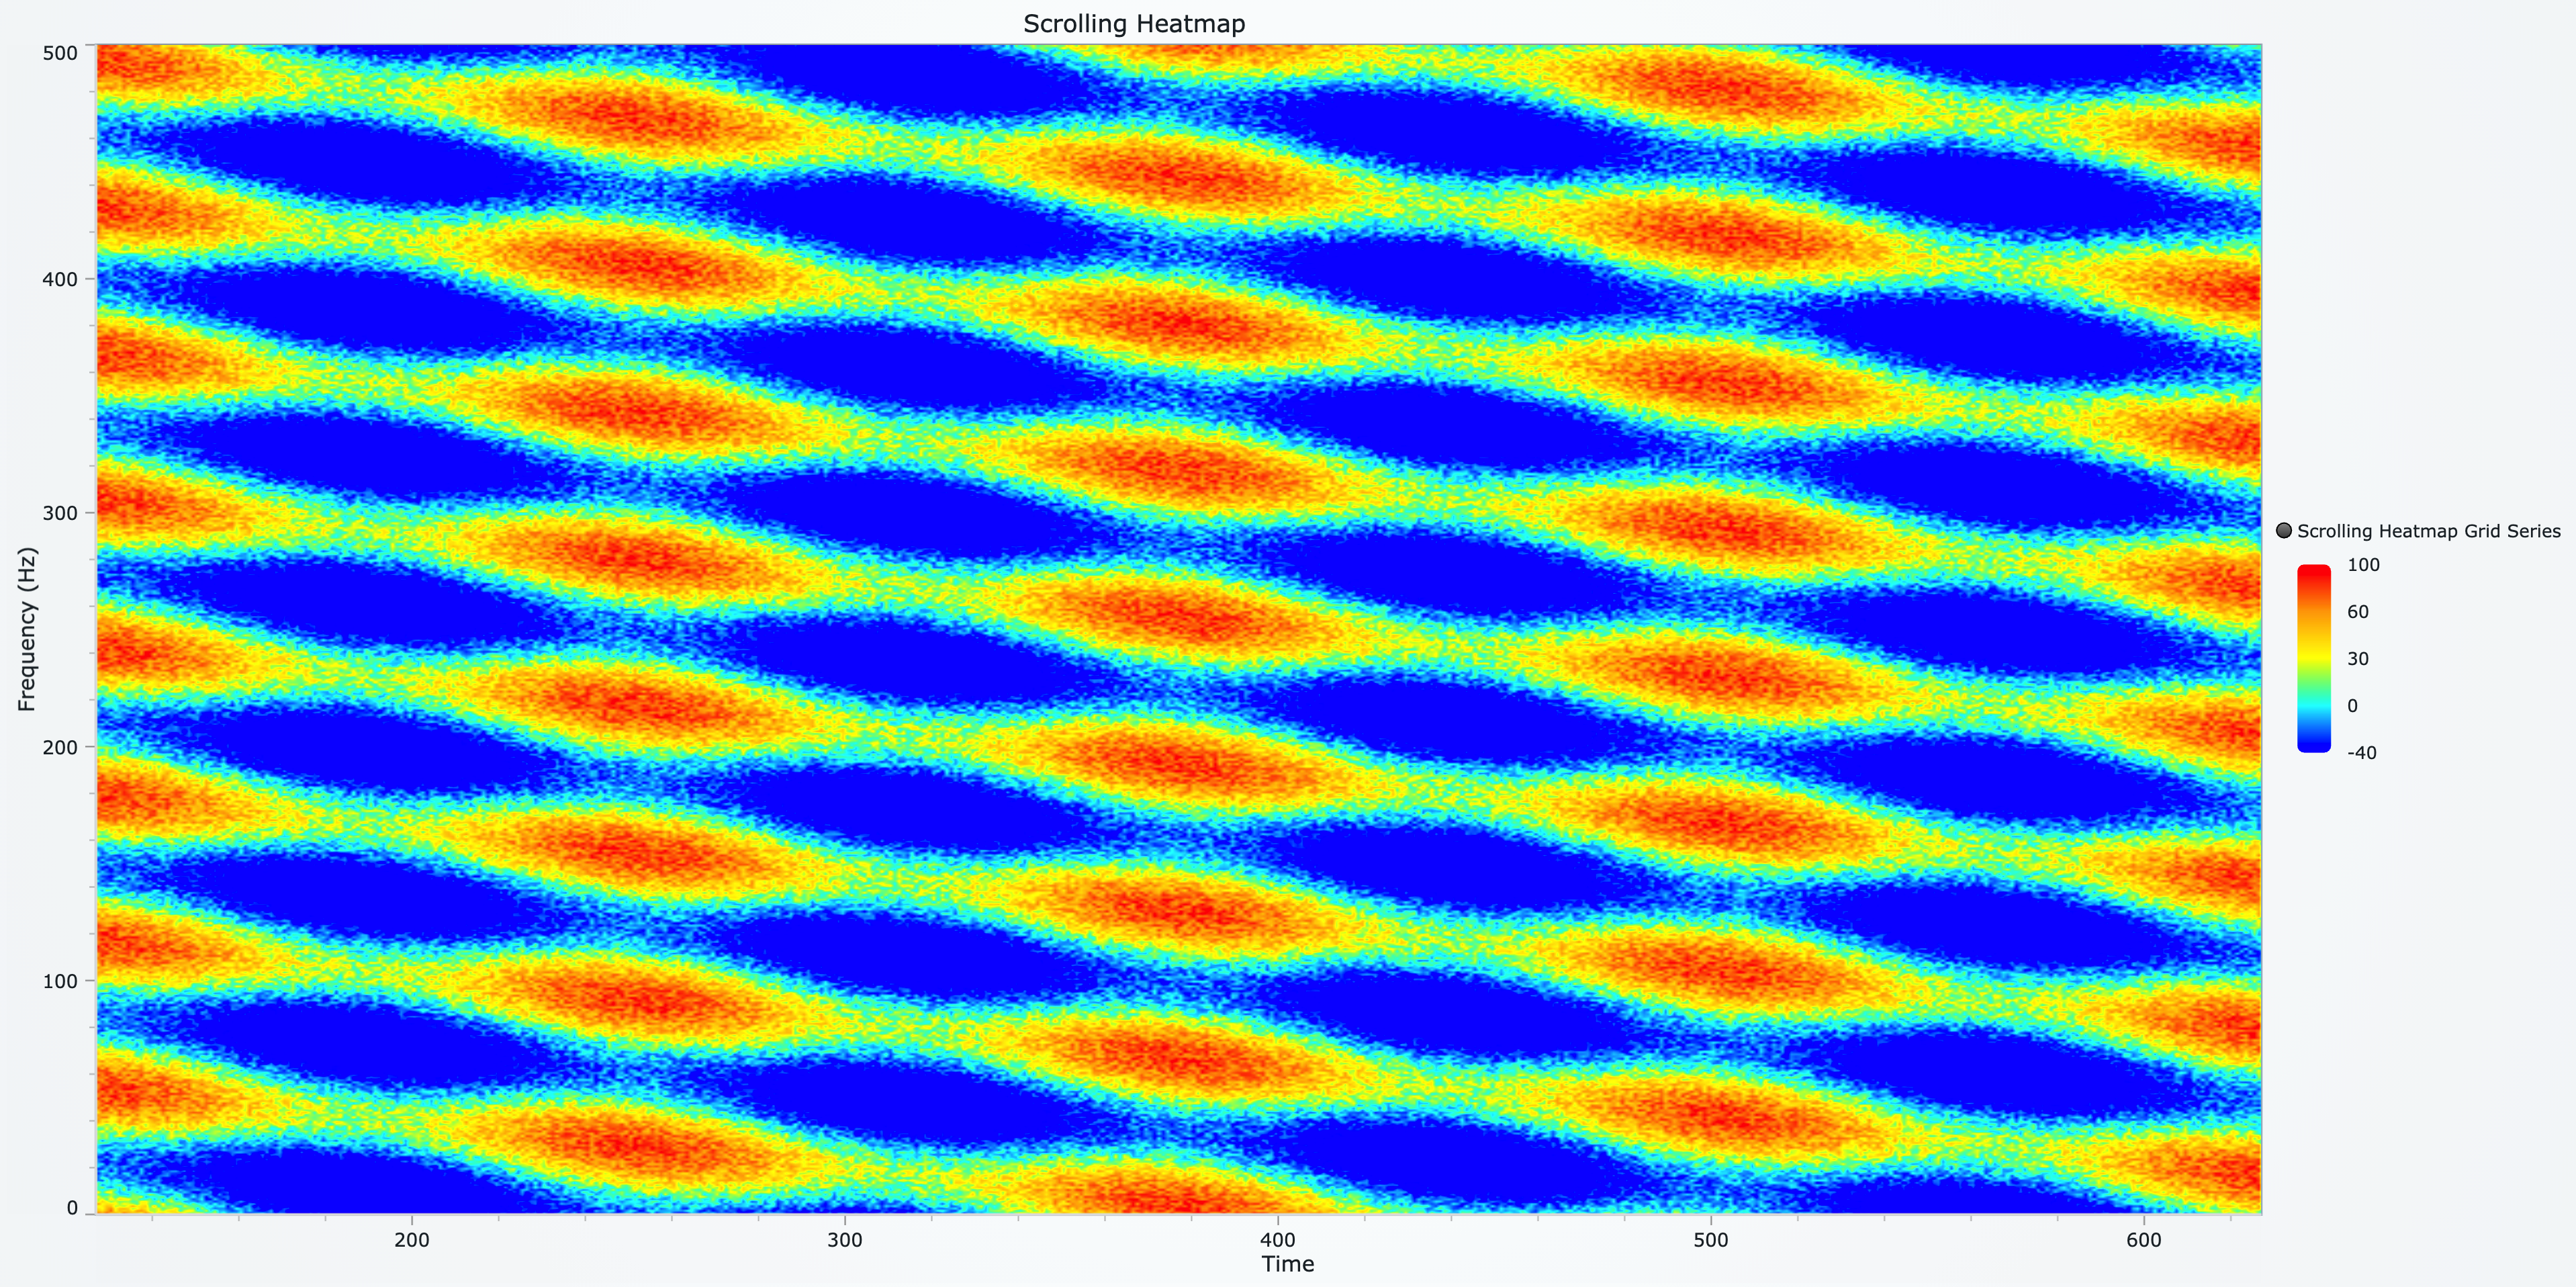
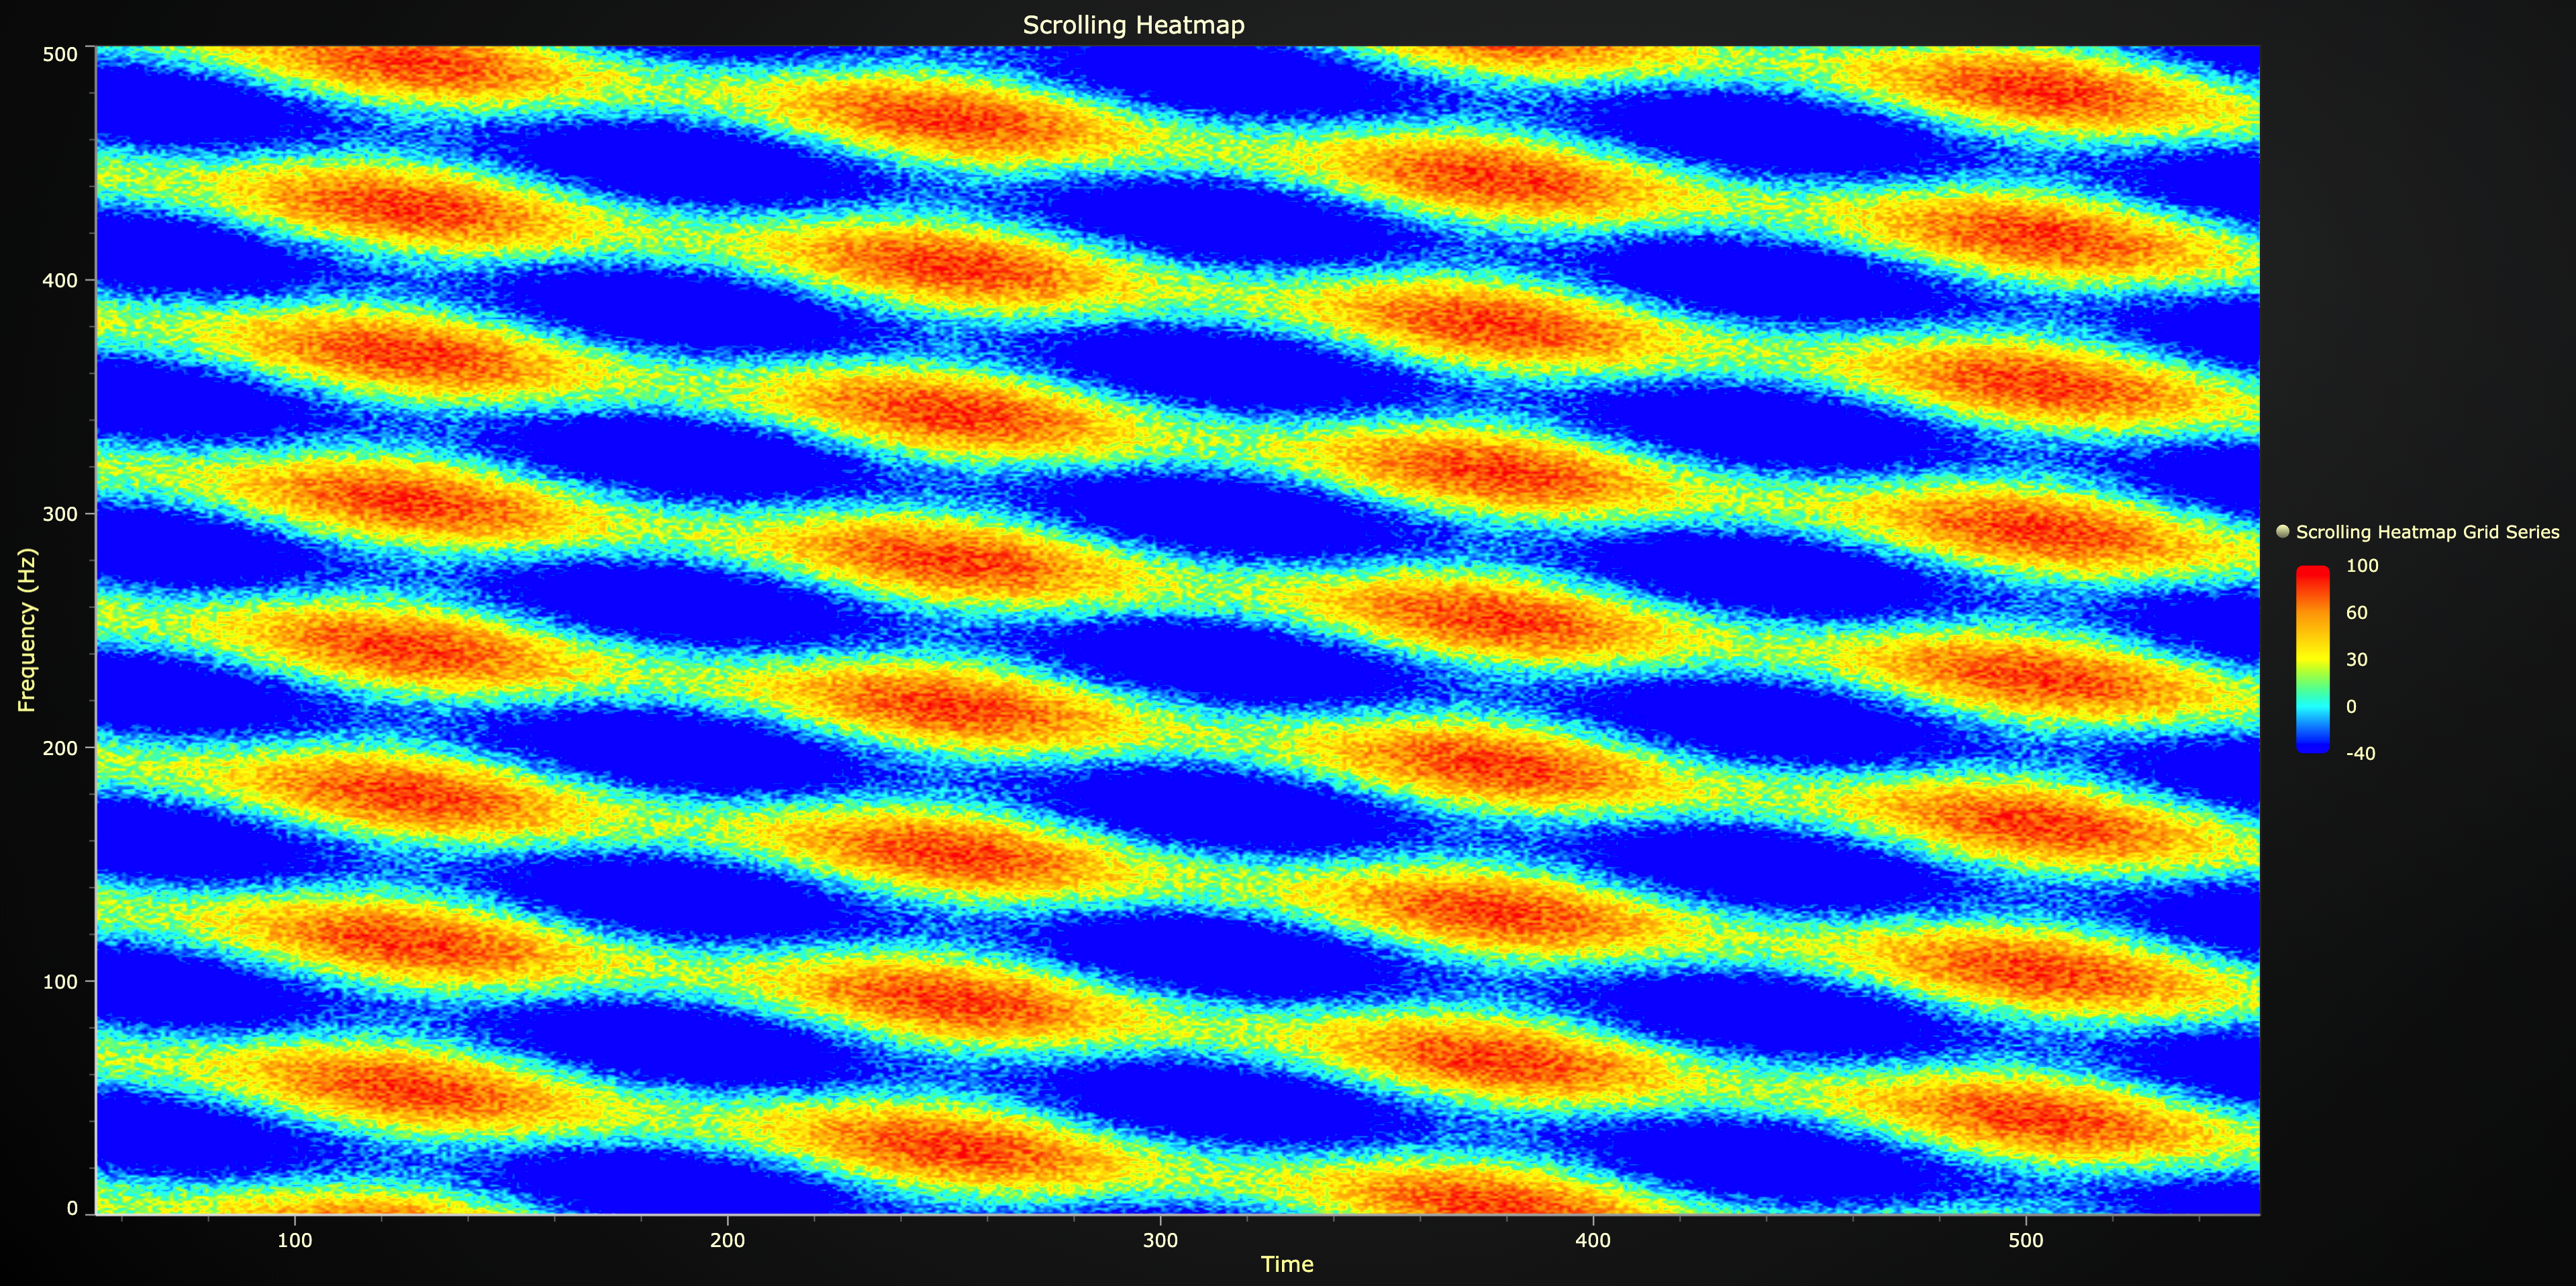
chart = lc.ChartXY(
title='Scrolling Spectrogram',
theme=lc.Themes.Light
)
# Set up axes
x_axis = chart.get_default_x_axis()
x_axis.set_title('Time')
x_axis.set_scroll_strategy(progressive=True)
x_axis.set_interval(-time_window, 0, stop_axis_after=False)
y_axis = chart.get_default_y_axis()
y_axis.set_title('Frequency (Hz)')
y_axis.set_interval(0, resolution)
# Add heatmap series
series = chart.add_heatmap_scrolling_grid_series(
resolution=resolution,
scroll_dimension='columns',
)
series.hide_wireframe()
# Set palette colors
series.set_palette_coloring(
steps=[
{'value': -40, 'color': ('blue')},
{'value': 0, 'color': ('cyan')},
{'value': 30, 'color': ('yellow')},
{'value': 60, 'color': ('orange')},
{'value': 100, 'color': ('red')},
],
percentage_values=False
)
# Open chart as live
chart.open(live=True)
# Add data to the heatmap
for t in range(2000):
column = [generate_spectrogram_column(t)]
series.add_intensity_values(column)
time.sleep(0.01)
chart.close()