import numpy as np
import lightningchart as lc
lc.set_license('my-license-key')
array_3d = np.random.normal(loc=0, scale=1, size=(100, 100, 100))
slice_data = array_3d[50, :, :]
slice_data = slice_data.astype(float)
slice_data[slice_data == 0] = np.nan
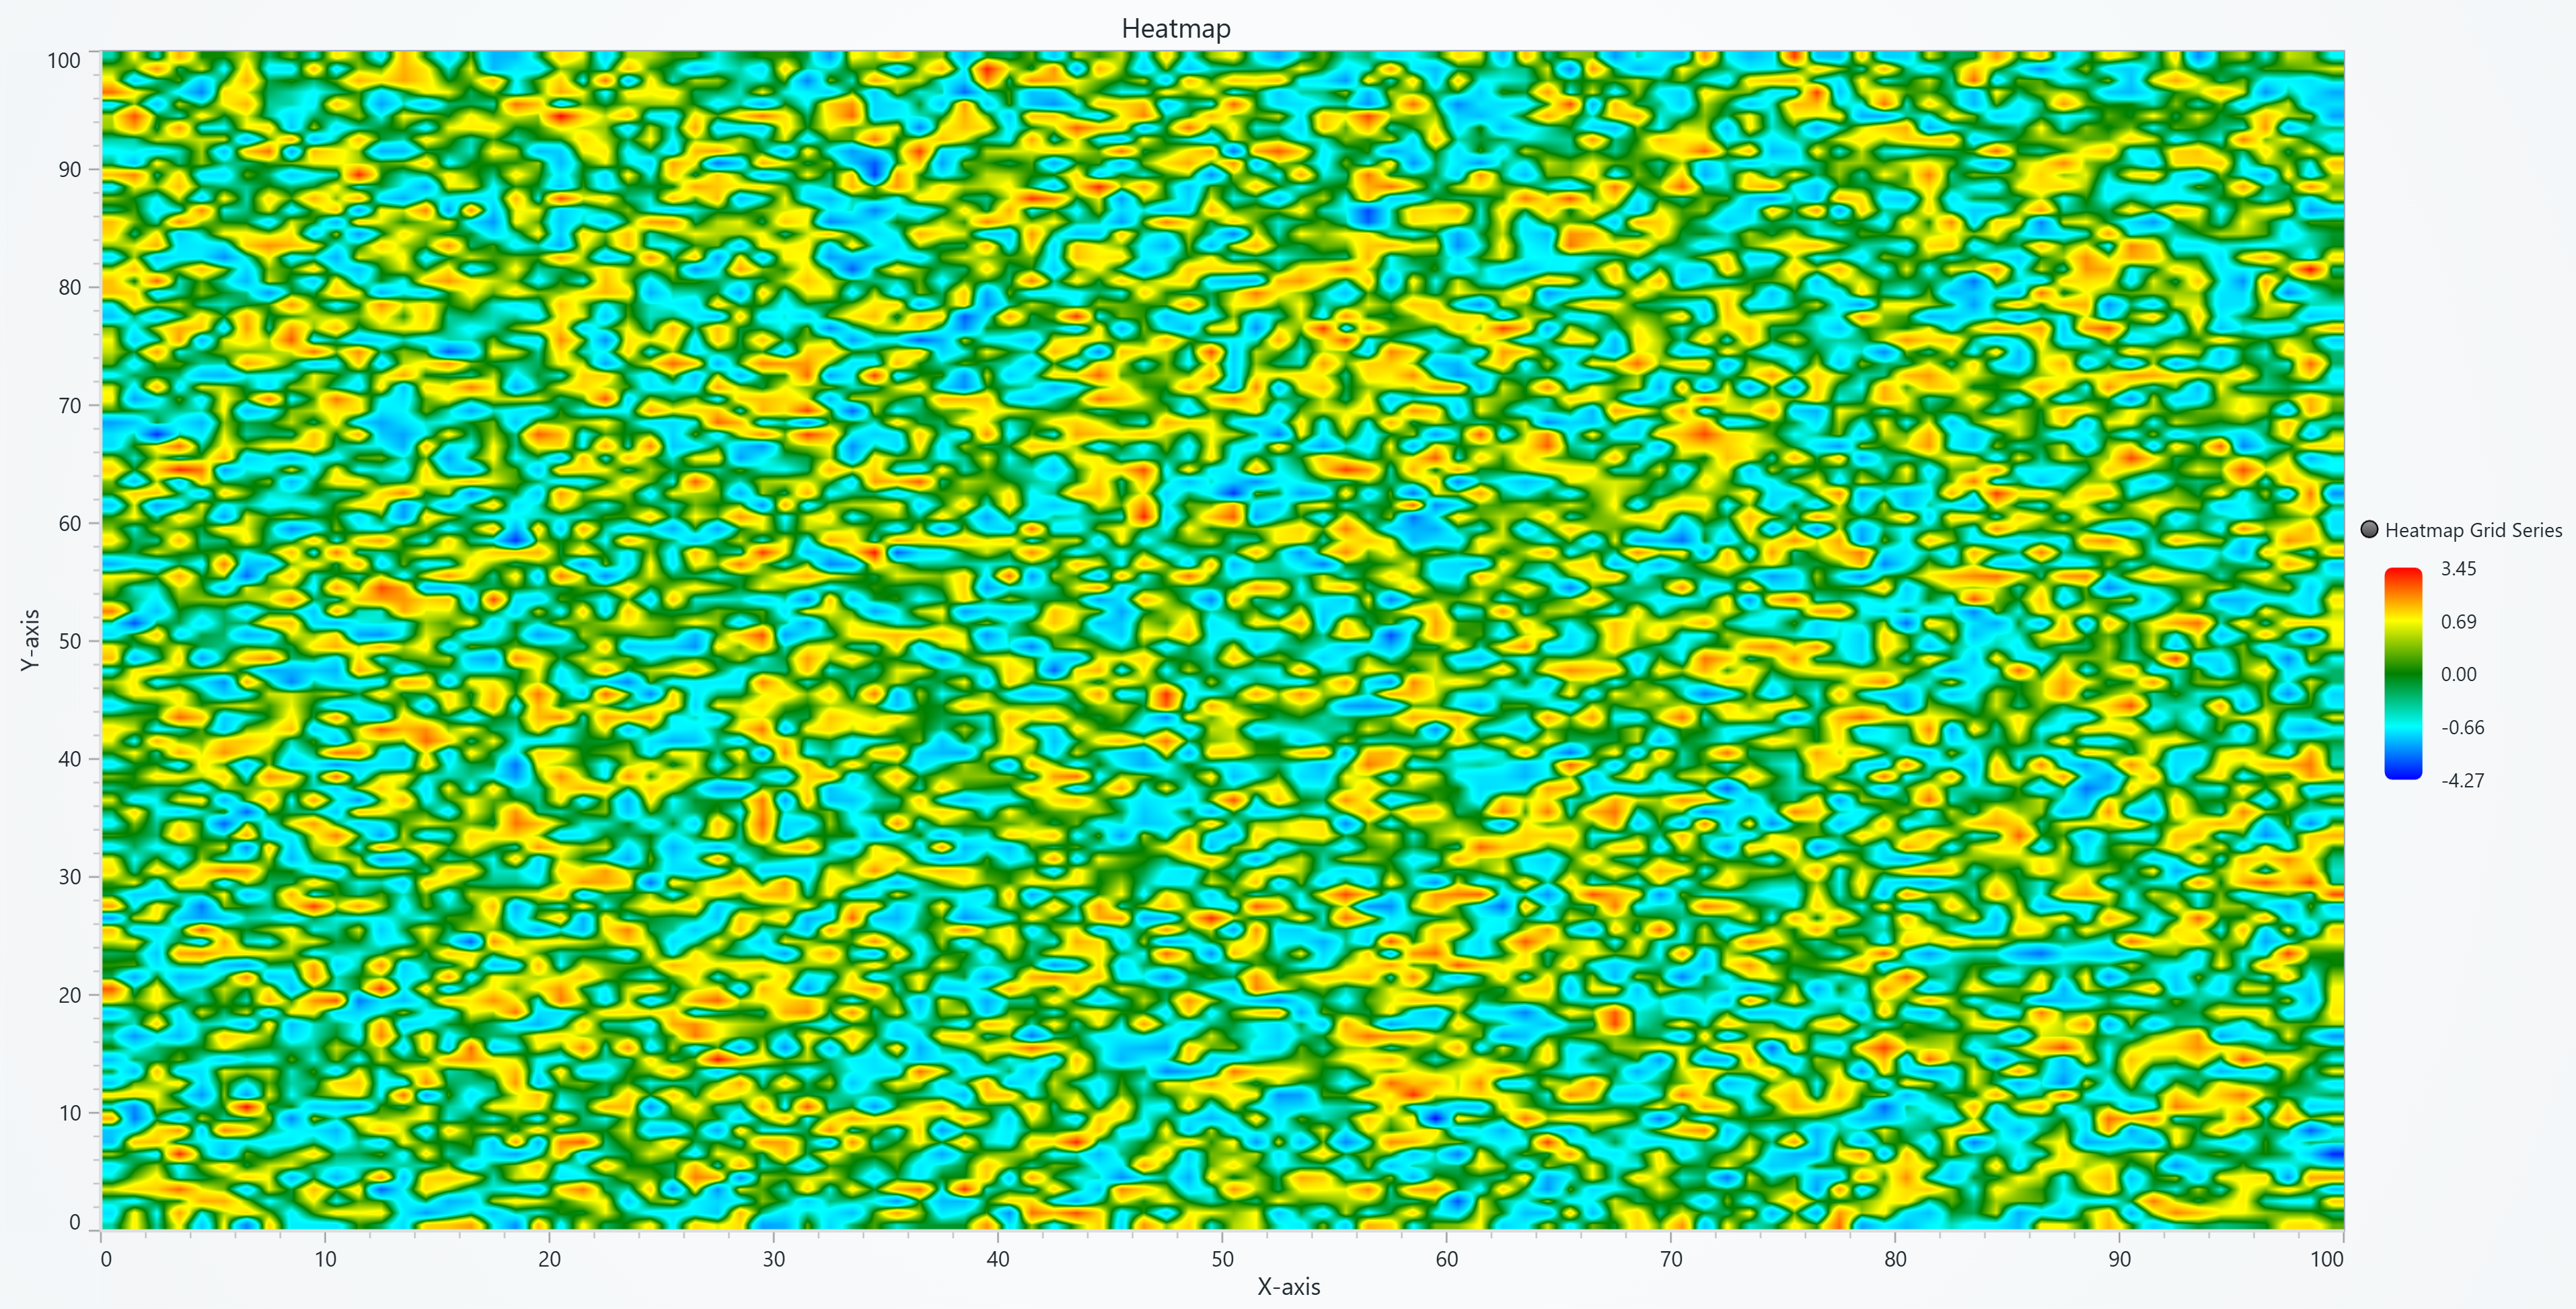
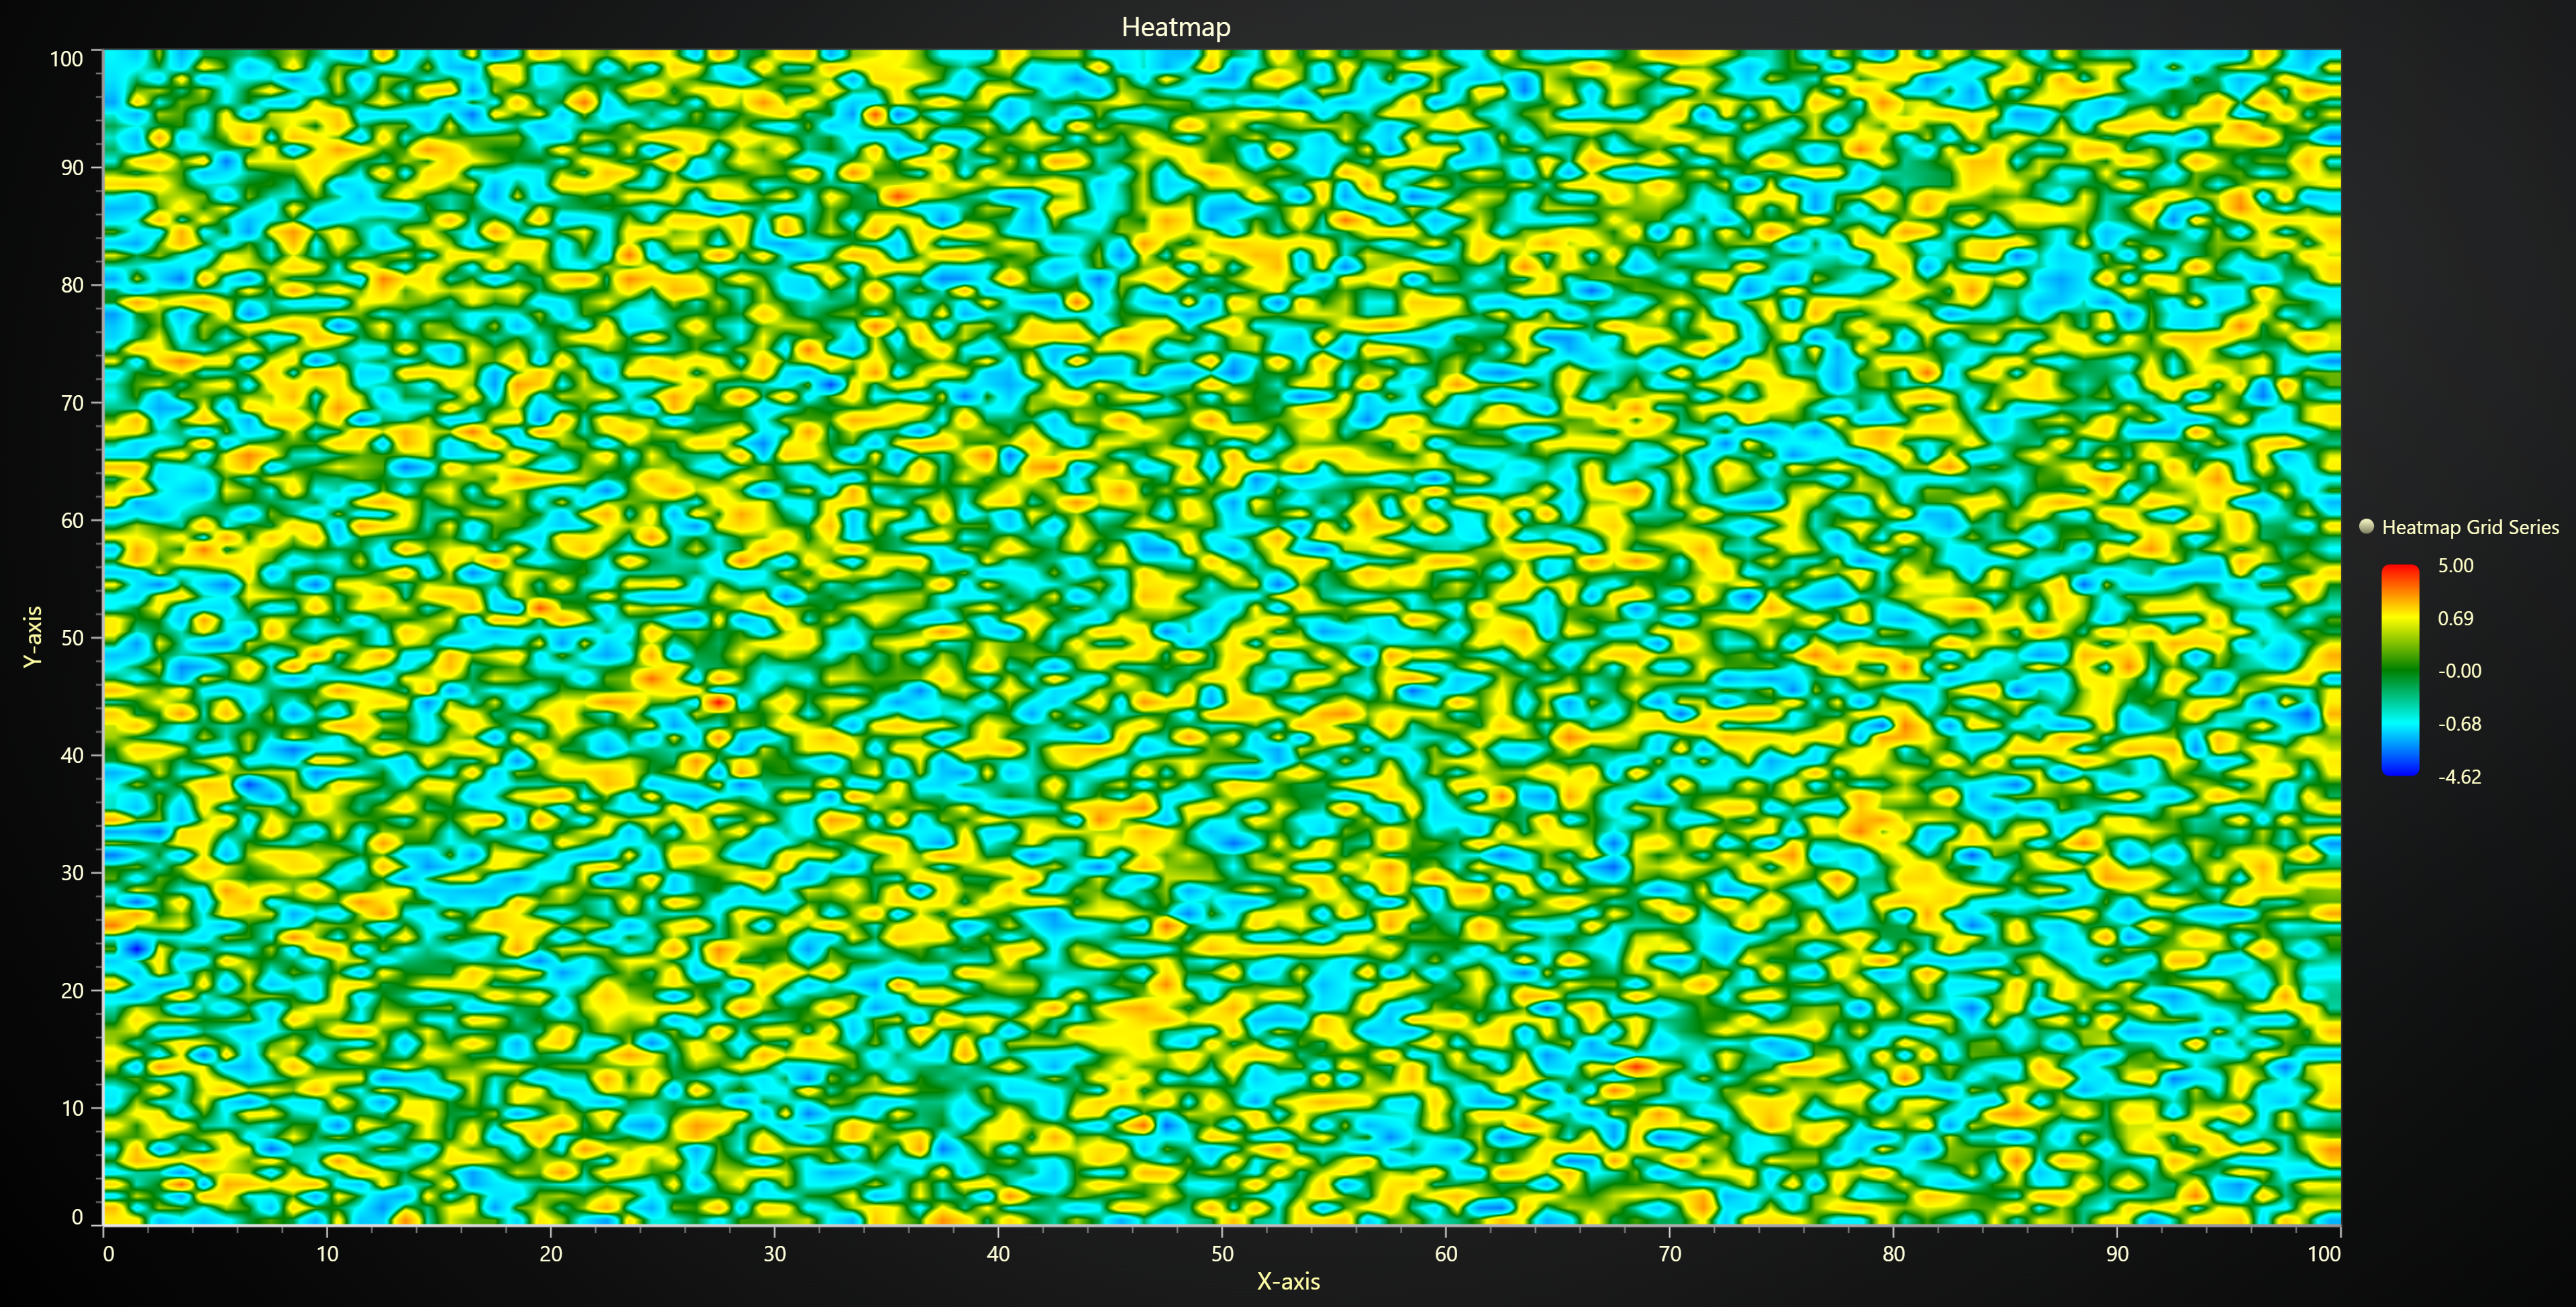
chart = lc.ChartXY(
title='Heatmap',
theme=lc.Themes.Light
)
grid_size_x, grid_size_y = slice_data.shape
heatmap_series = chart.add_heatmap_grid_series(
columns=grid_size_x,
rows=grid_size_y,
)
heatmap_series.set_start(x=0, y=0)
heatmap_series.set_end(x=grid_size_x, y=grid_size_y)
heatmap_series.set_step(x=1, y=1)
heatmap_series.set_intensity_interpolation(True)
heatmap_series.invalidate_intensity_values(slice_data.tolist())
heatmap_series.hide_wireframe()
custom_palette = [
{"value": np.nanmin(slice_data), "color": ('blue')},
{"value": np.nanpercentile(slice_data, 25), "color": ('cyan')},
{"value": np.nanmedian(slice_data), "color": ('green')},
{"value": np.nanpercentile(slice_data, 75), "color": ('yellow')},
{"value": np.nanmax(slice_data), "color": ('red')}
]
heatmap_series.set_palette_coloring(
steps=custom_palette,
look_up_property='value',
interpolate=True,
formatter_precision=2
)
chart.get_default_x_axis().set_title('X-axis')
chart.get_default_y_axis().set_title('Y-axis')
chart.open()