Axis
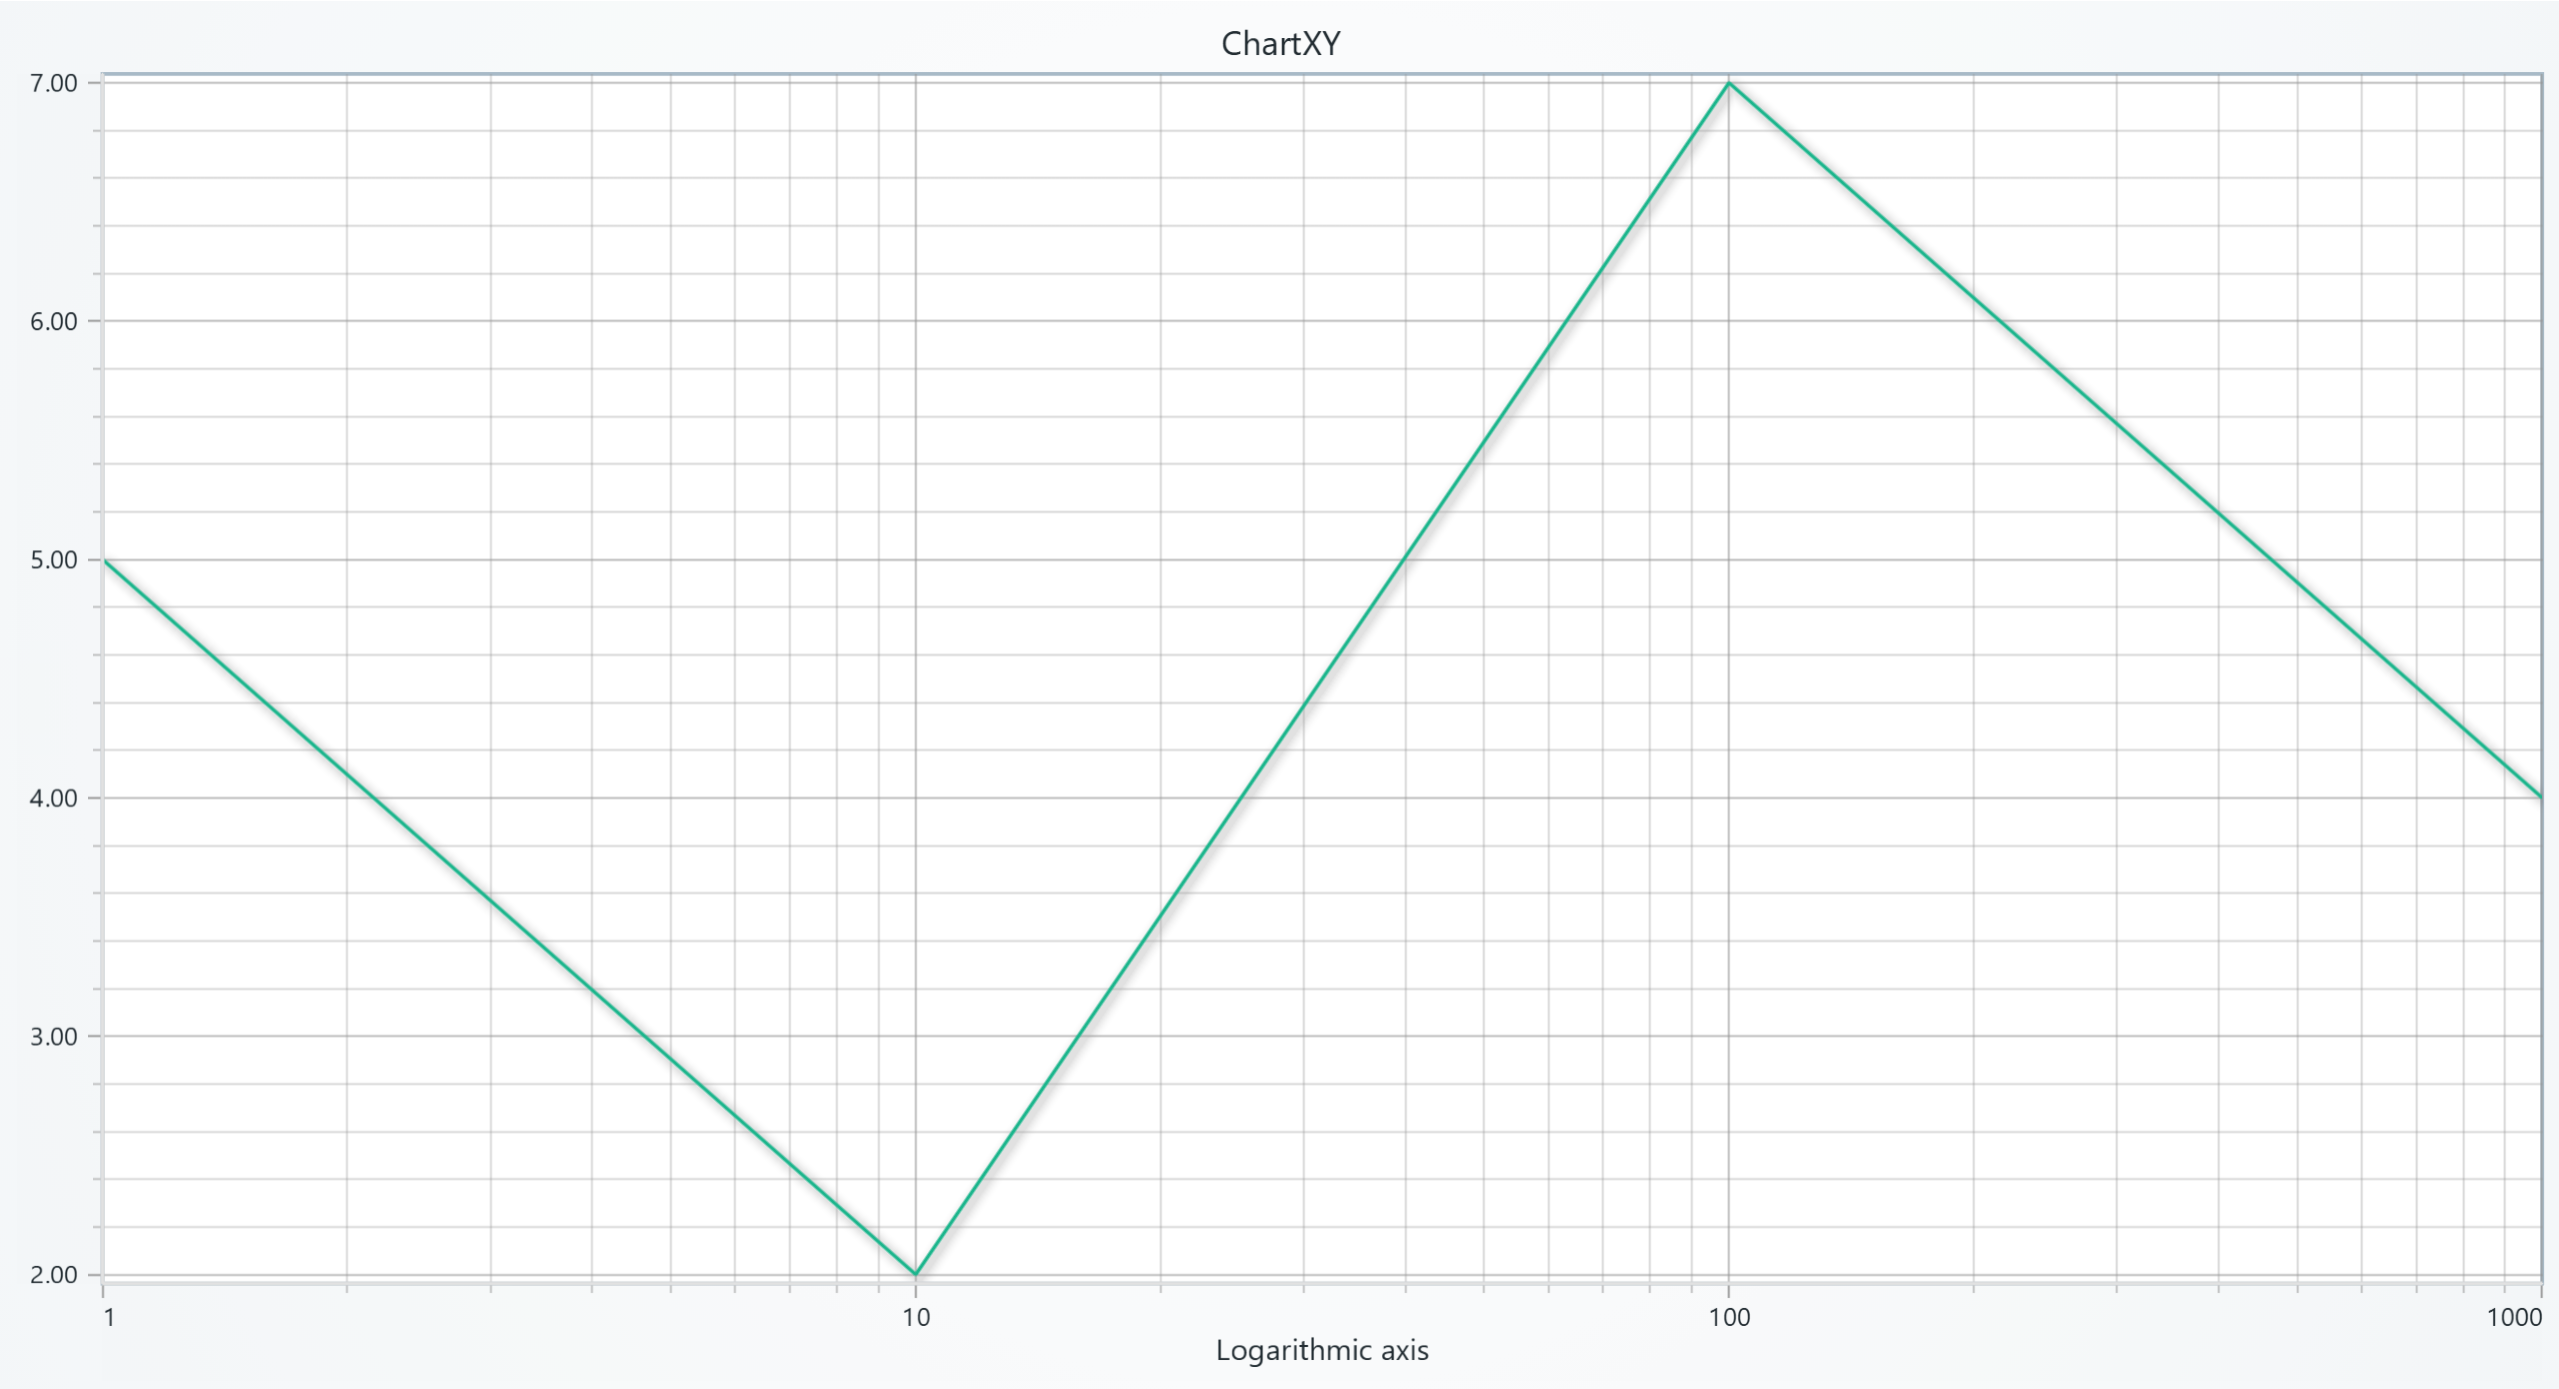
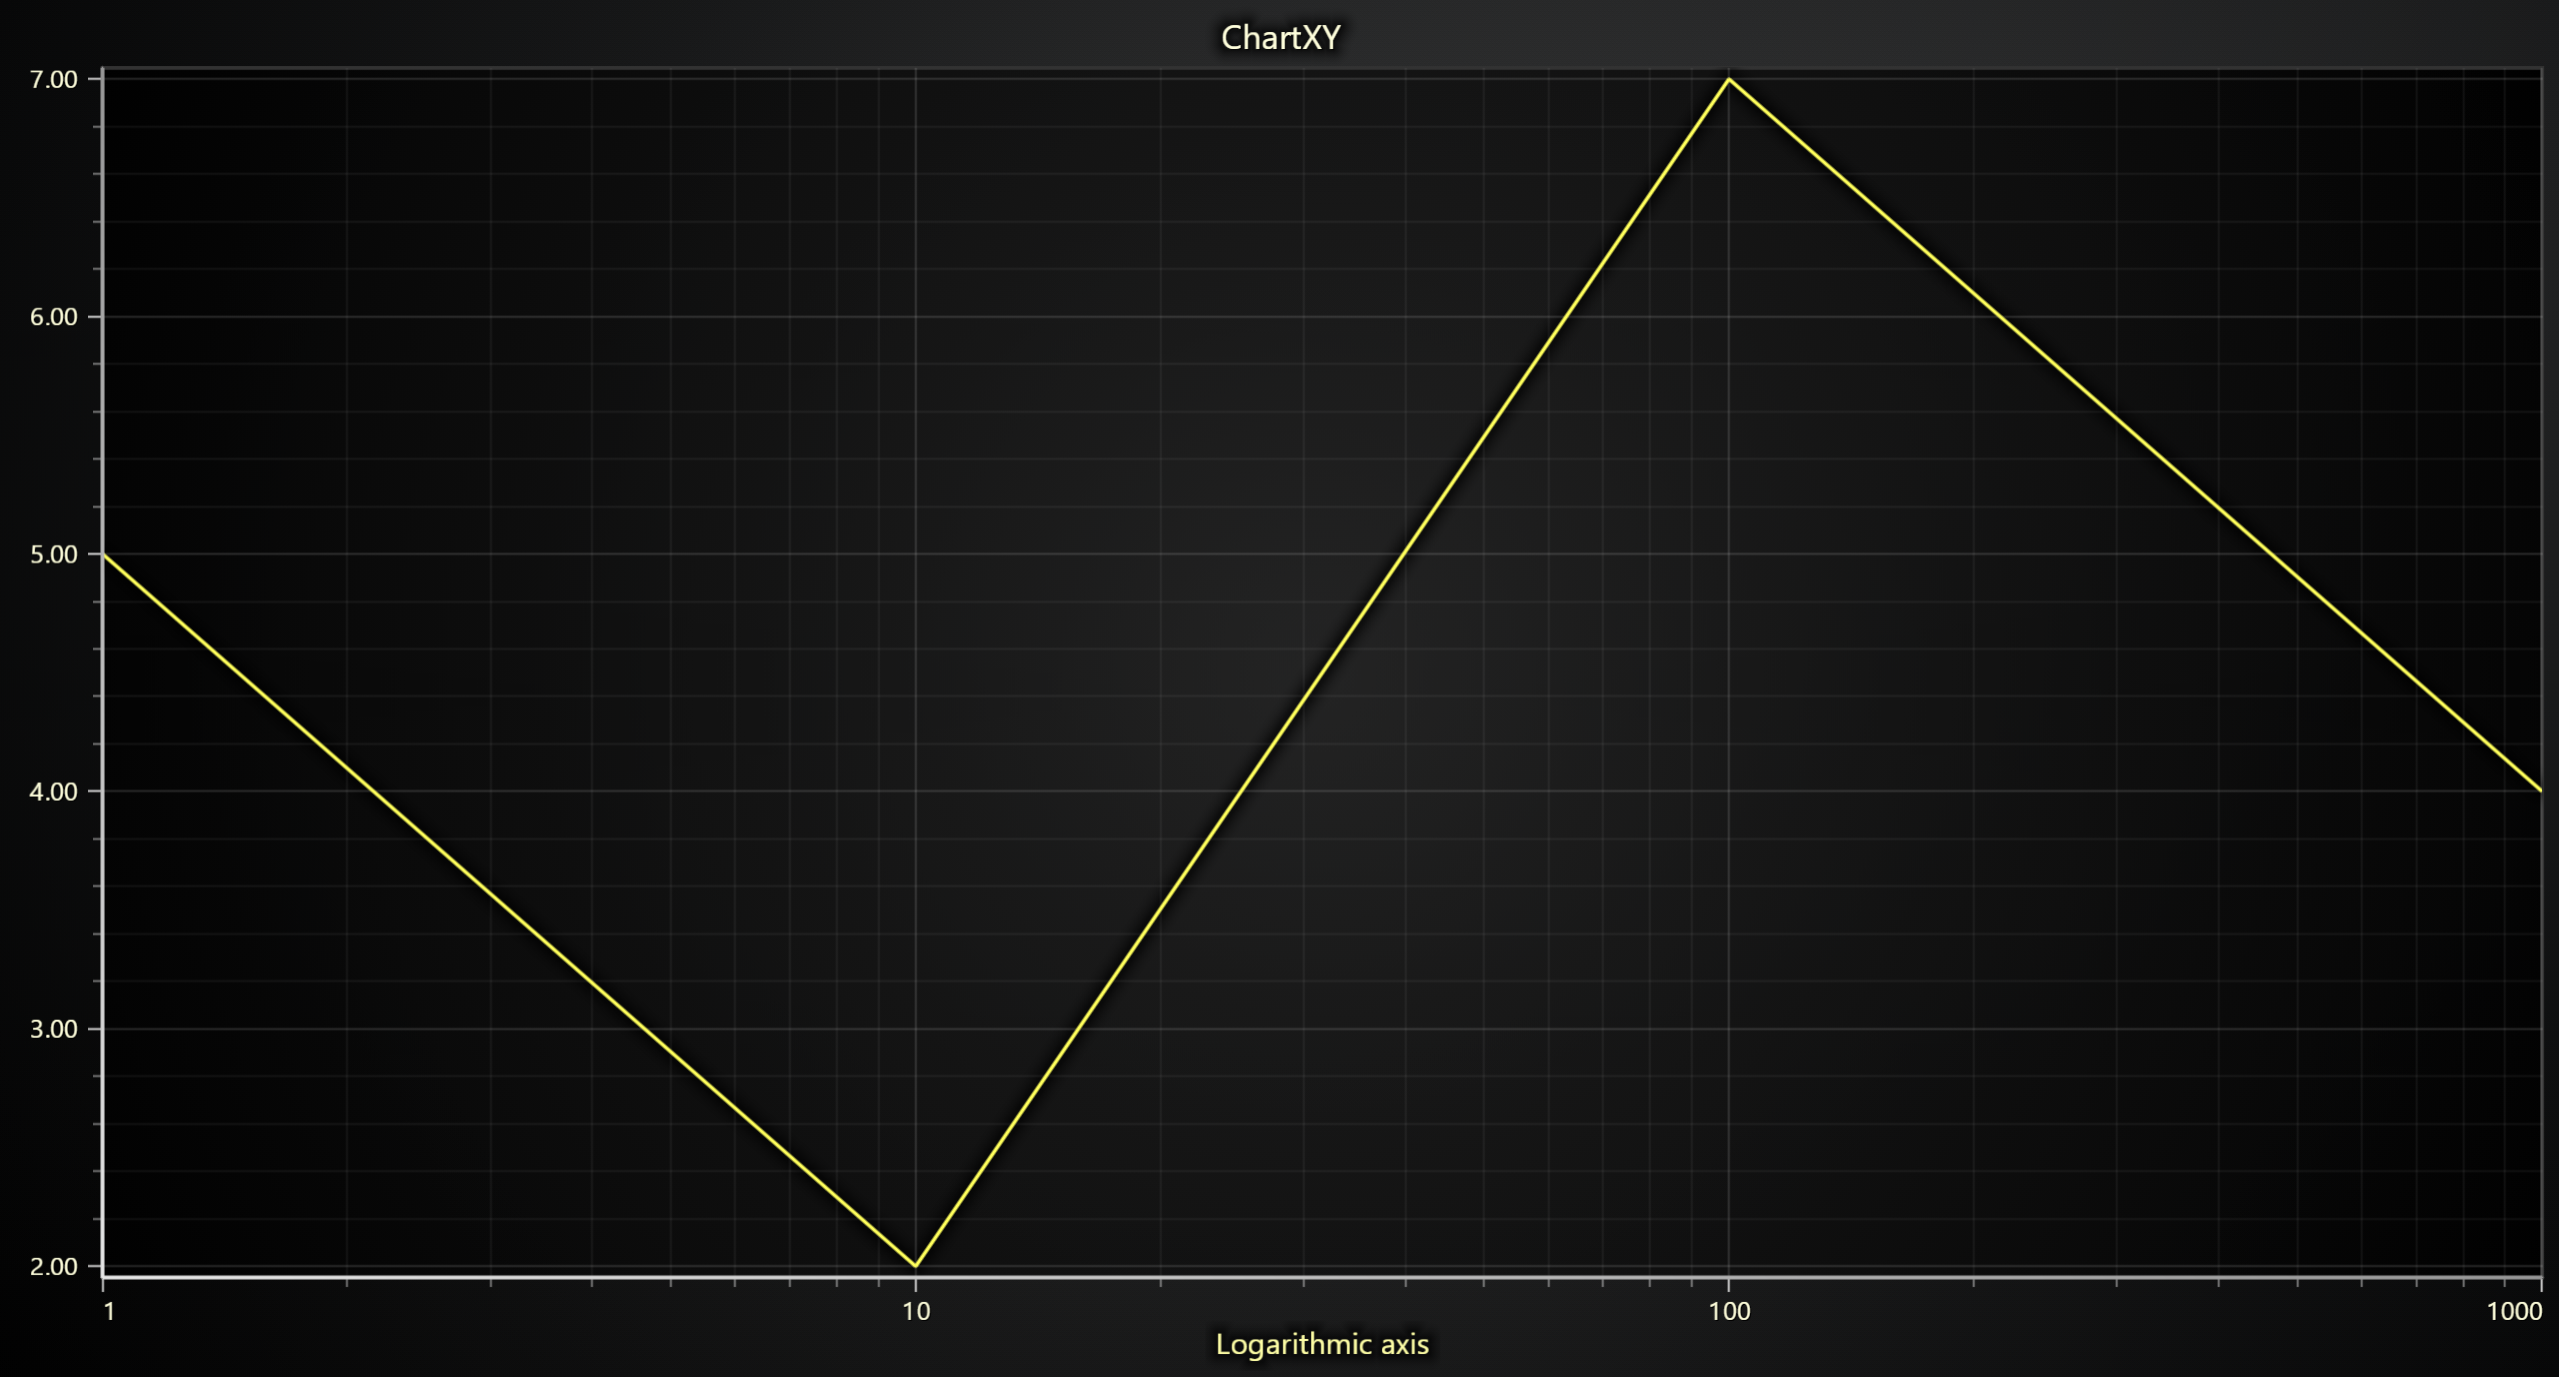
Logarithmic Axis
import lightningchart as lc

lc.set_license('my-license-key')

chart = lc.ChartXY()

default_axis = chart.get_default_x_axis()  # get the reference to the default x-axis
default_axis.dispose()  # remove the default x-axis

custom_axis = chart.add_x_axis(
    opposite=False,
    axis_type='logarithmic',  # Create a new axis of logarithmic type
    base=10
)
custom_axis.set_interval(start=1, end=1000)
custom_axis.set_title('Logarithmic axis')
series = chart.add_line_series(x_axis=custom_axis)
series.add(x=[1, 10, 100, 1000], y=[5, 2, 7, 4])

chart.open()
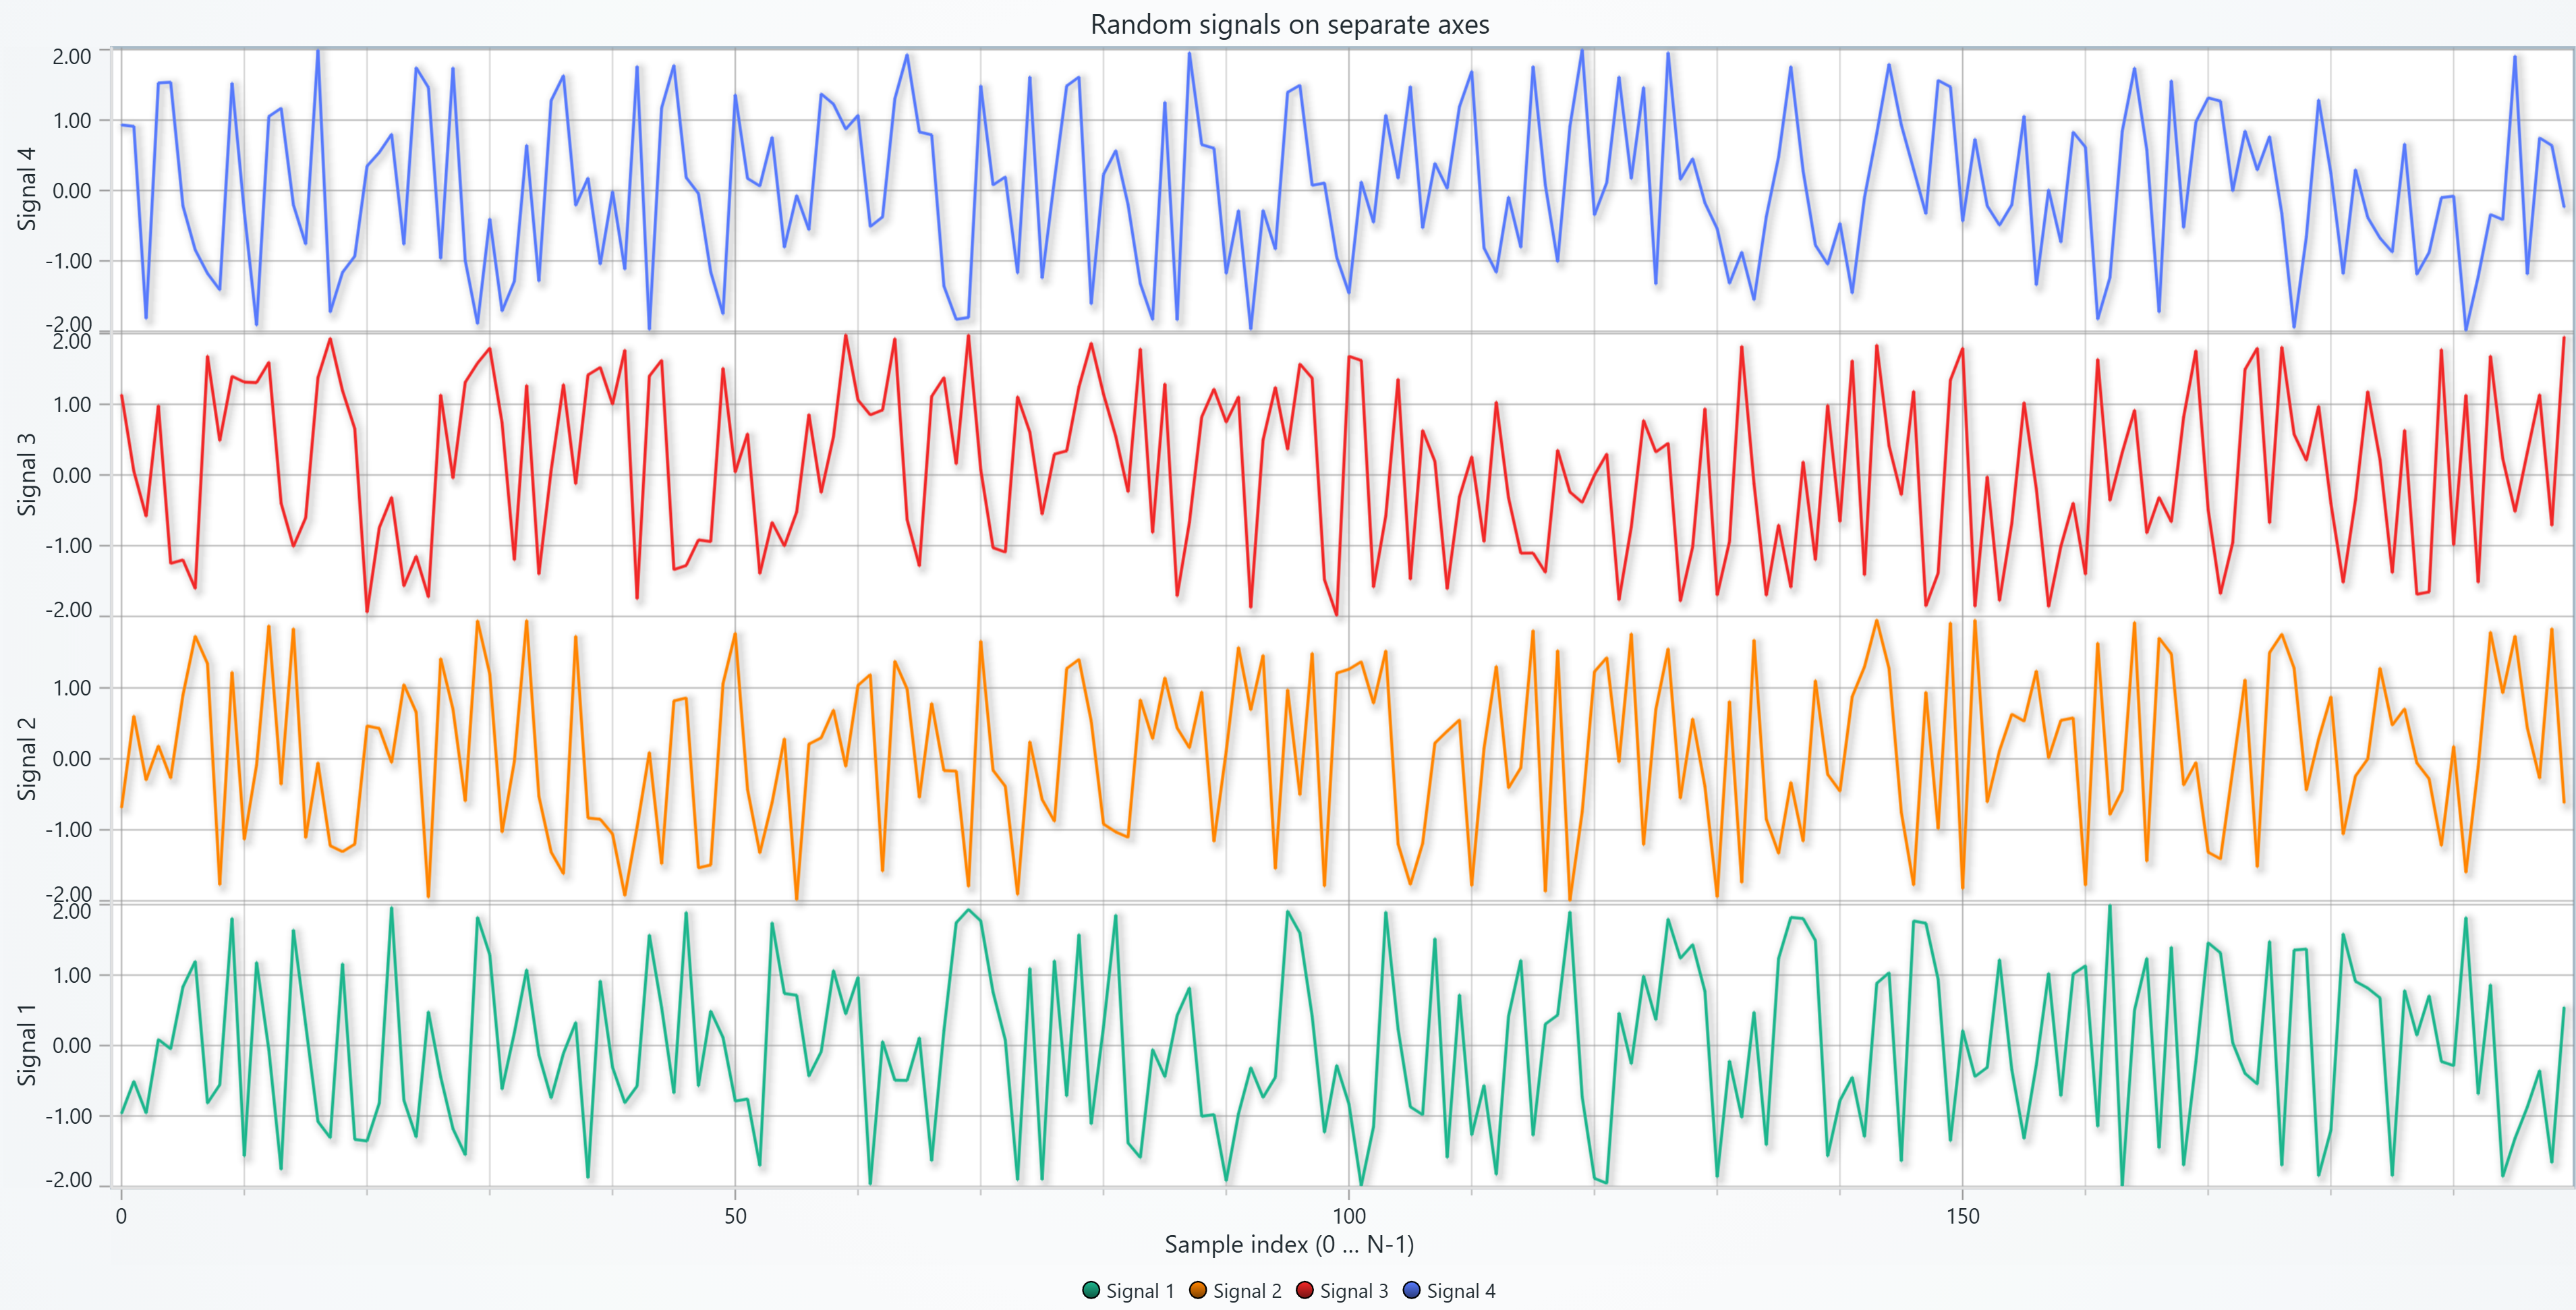
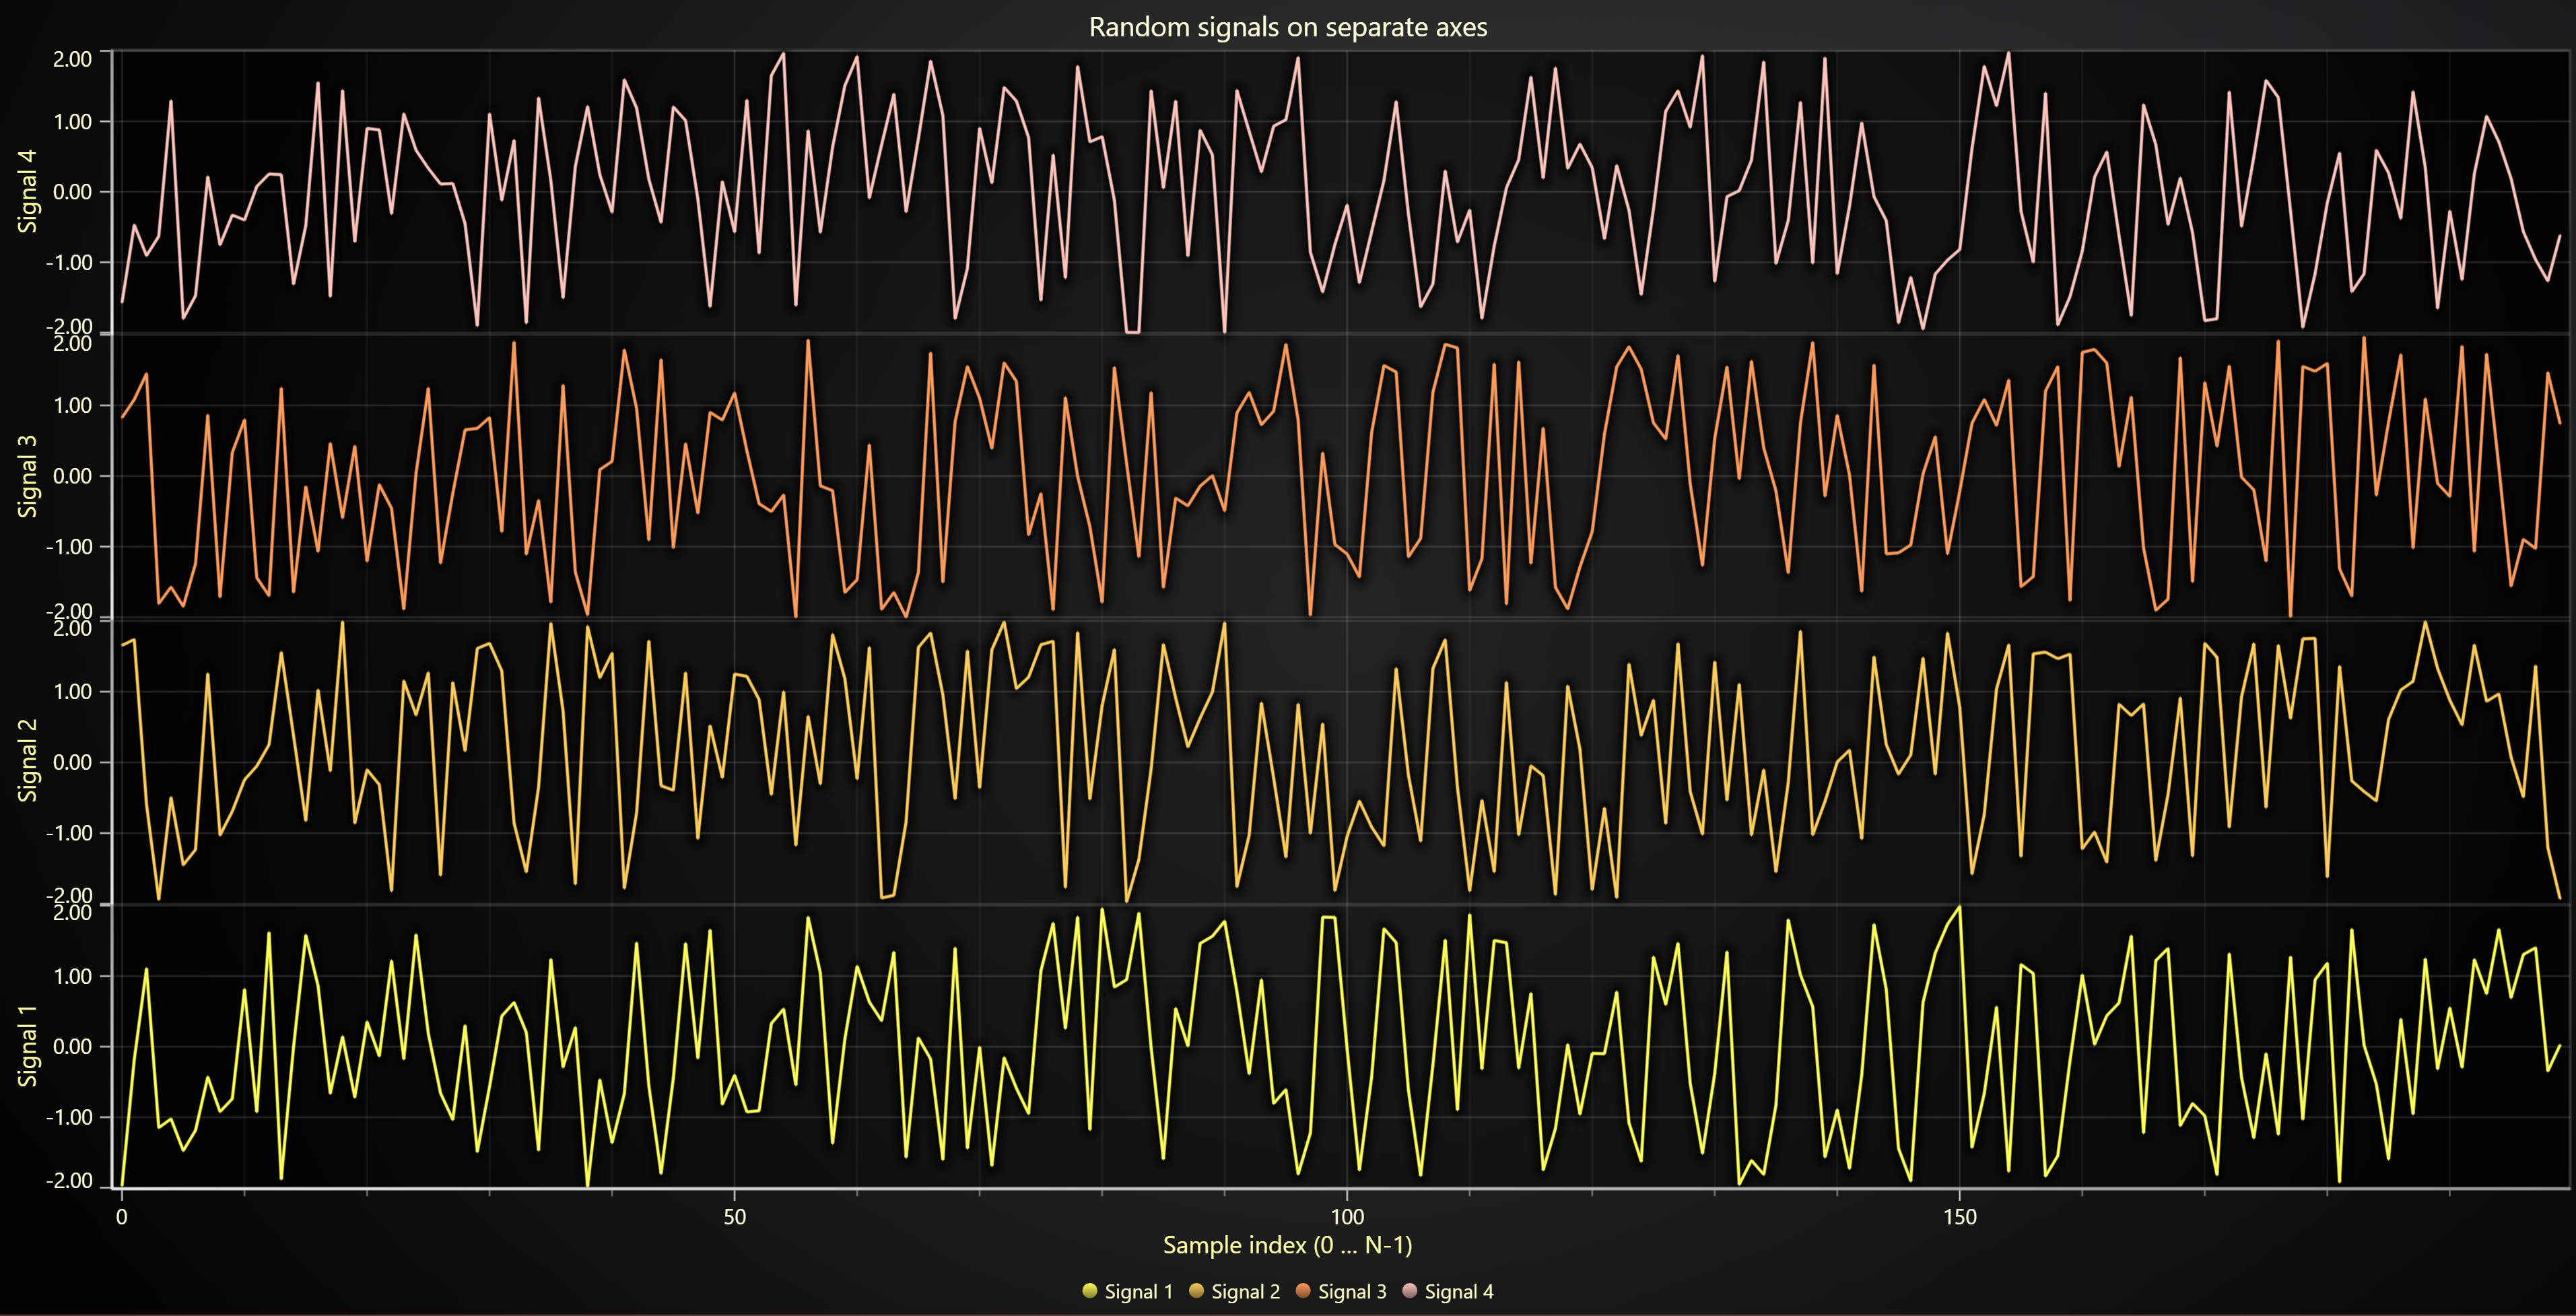
Multi Y-Axis Chart
import random
import lightningchart as lc

lc.set_license('my-license-key')

# Initialize the chart
chart = lc.ChartXY(
    theme=lc.Themes.Light,
    title='Random signals on separate axes'
)

chart.set_background_stroke(2, ('red'))
chart.get_default_y_axis().dispose()
# Create a few random series

N_SERIES = 4  # number of separate axes / traces
N_POINTS = 200  # points per trace
x_values = list(range(N_POINTS))

for i in range(N_SERIES):
    y_values = [random.uniform(-2.0, 2.0) for _ in x_values]

    # Create a Y-axis stacked under the previous one
    axis_y = chart.add_y_axis(stack_index=i)
    axis_y.set_title(f'Signal {i+1}')

    # Add line series
    series = chart.add_line_series(y_axis=axis_y)
    series.add(x_values, y_values)
    series.set_name(f'Signal {i+1}')

# Set the common X-axis title
chart.get_default_x_axis().set_title(
    'Sample index (0 … N-1)'
)
chart.open()