Figures and Text
import lightningchart as lc
import random
# Set the license key
lc.set_license('my-license-key')
# Create a chart
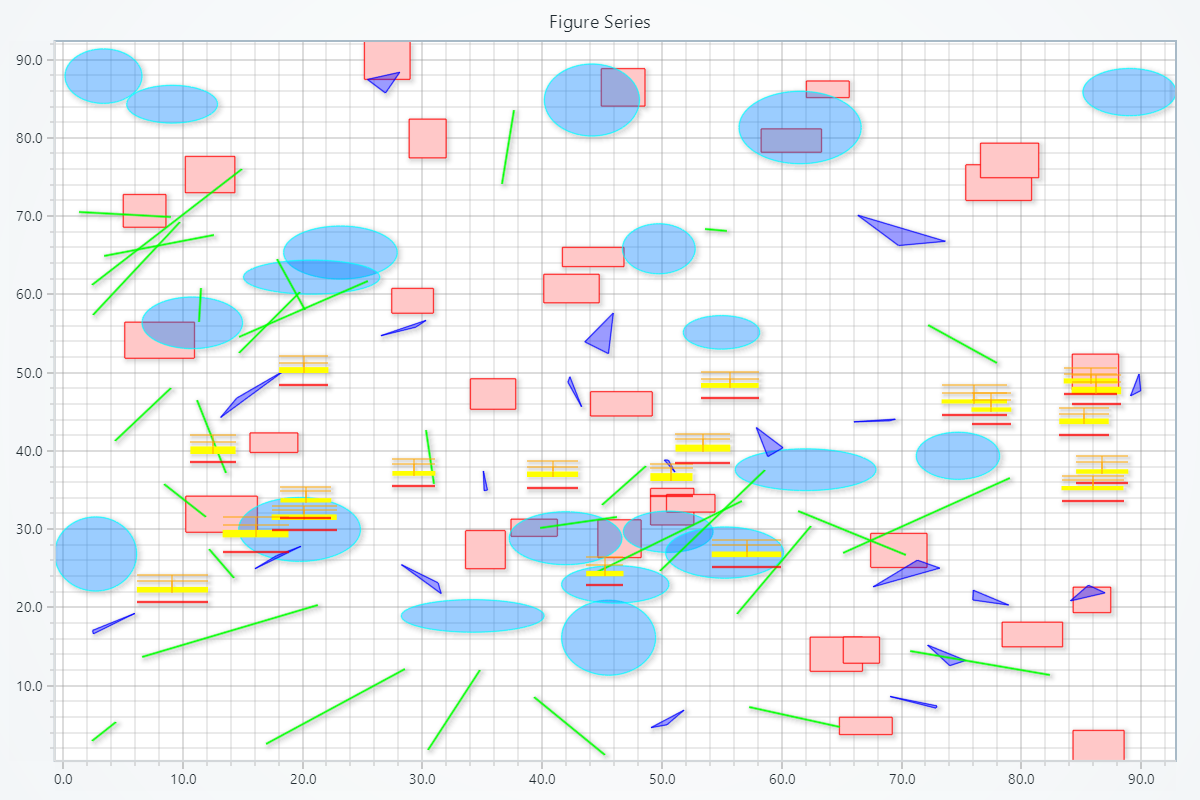
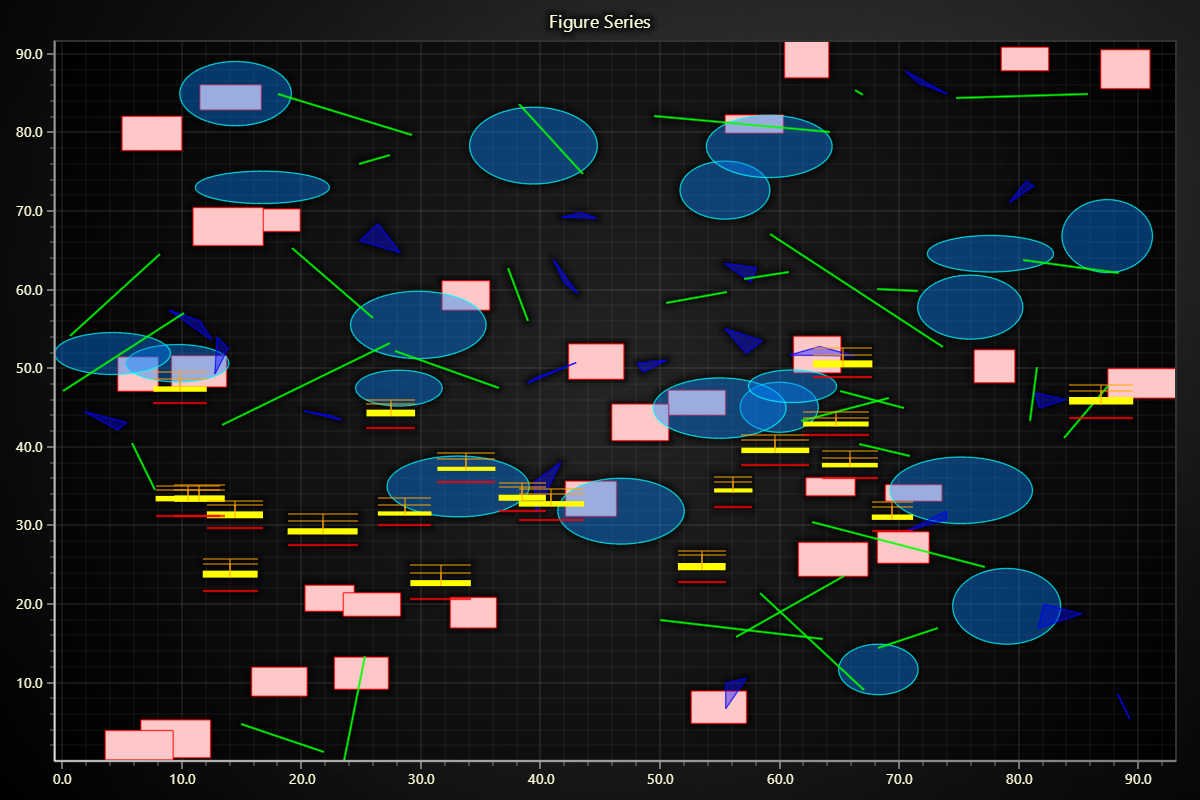
chart = lc.ChartXY(title="ChartXY with Adjusted Figures", theme=lc.Themes.Light)
# Add a rectangle series
rectangle_series = chart.add_rectangle_series()
# Add some rectangles using random values
for _ in range(30):
x1, y1 = random.uniform(0, 90), random.uniform(0, 90)
width, height = random.uniform(3, 6), random.uniform(2, 5)
# Add points to the series
rectangle_figure = rectangle_series.add(x1, y1, x1 + width, y1 + height)
# Define the stroke color and thickness
rectangle_figure.set_stroke(thickness= 1, color= (255, 0, 0))
# Define the fill color
rectangle_figure.set_color(color= (255, 200, 200))
# Add an ellipse series
ellipse_series = chart.add_ellipse_series()
# Add some ellipses using random values
for _ in range(20):
center_x, center_y = random.uniform(0, 90), random.uniform(0, 90)
radius_x, radius_y = random.uniform(3, 6), random.uniform(2, 5)
# Add points to the series
ellipse_figure = ellipse_series.add(center_x, center_y, radius_x, radius_y)
# Define the stroke color and thickness
ellipse_figure.set_stroke(thickness= 1, color= (0, 255, 255))
# Define the fill color
ellipse_figure.set_color(color= (0, 128, 255, 100))
# Add a polygon series
polygon_series = chart.add_polygon_series()
# Add some polygons using random values
for _ in range(20):
while True:
point1 = {'x': random.uniform(0, 90), 'y': random.uniform(0, 90)}
point2 = {'x': point1['x'] + random.uniform(-4, 4), 'y': point1['y'] + random.uniform(-4, 4)}
point3 = {'x': point2['x'] + random.uniform(-4, 4), 'y': point2['y'] + random.uniform(-4, 4)}
if all(0 <= p['x'] <= 90 and 0 <= p['y'] <= 90 for p in [point1, point2, point3]):
break
points = [point1, point2, point3]
# Add points to the series
polygon_figure = polygon_series.add(points)
# Define the stroke color and thickness
polygon_figure.set_stroke(thickness= 1, color= (0, 0, 255))
# Define the fill color
polygon_figure.set_color(color= (0, 0, 255, 100))
# Add a segment series
segment_series = chart.add_segment_series()
# Add some figures using random values
for _ in range(30):
while True:
x1, y1 = random.uniform(0, 90), random.uniform(0, 90)
x2, y2 = x1 + random.uniform(-15, 15), y1 + random.uniform(-15, 15)
if 0 <= x2 <= 90 and 0 <= y2 <= 90:
break
# Add points to the series
segment_figure = segment_series.add_segment(x1, y1, x2, y2)
# Define the stroke color and thickness
segment_figure.set_stroke(thickness= 2, color= (0, 255, 0))
# Add a box series
box_series = chart.add_box_series()
# Add some boxes using random values
for _ in range(20):
start = random.uniform(0, 90)
end = start + random.uniform(3, 6)
lowerExtreme = random.uniform(20, 50)
lowerQuartile = lowerExtreme + random.uniform(1, 2)
median = lowerQuartile + random.uniform(0.5, 1)
upperQuartile = median + random.uniform(0.5, 1)
upperExtreme = upperQuartile + random.uniform(0.5, 1)
# Add points to the series
box_figure = box_series.add(start, end, lowerExtreme, lowerQuartile, median, upperQuartile, upperExtreme)
# Define the fill color
box_figure.set_body_color(color= (255, 255, 0))
# Define the stroke color and thickness
box_figure.set_stroke(thickness= 1, color= (255, 165, 0))
# Define the stroke color and thickness for the median
box_figure.set_median_stroke(thickness= 2, color= (255, 0, 0))
chart.open()
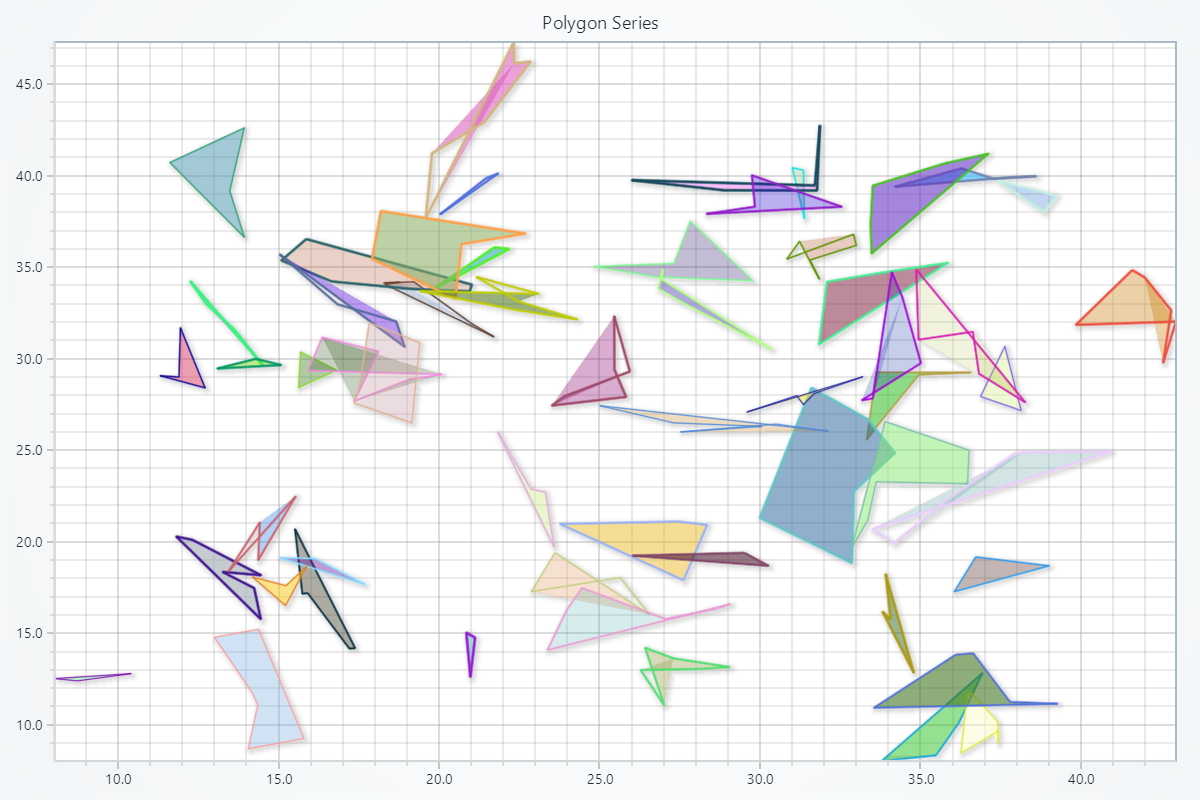
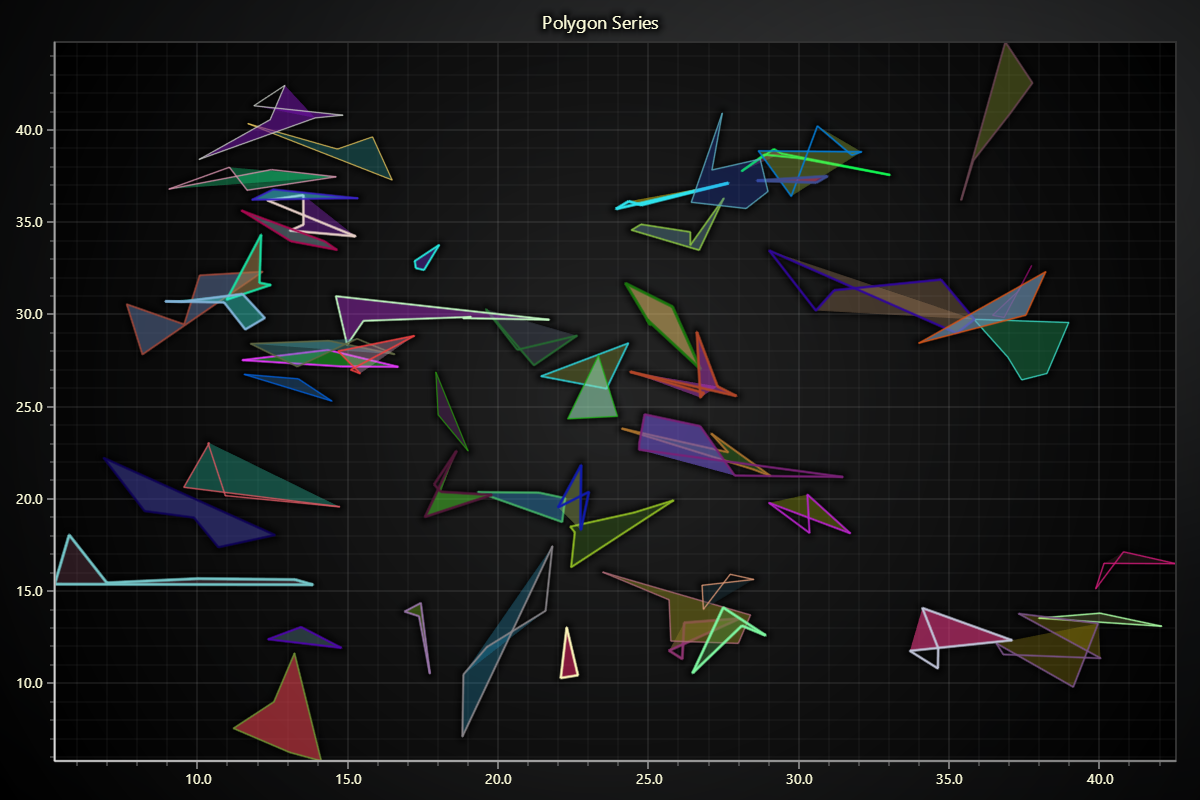
Polygon Series
import lightningchart as lc
import random
import math

# Set the license key
lc.set_license('my-license-key')

# Create a chart
chart = lc.ChartXY(
    title="Polygon Series",
    theme=lc.Themes.Light
)

# Add a polygon series
polygon_series = chart.add_polygon_series()

# Generate random points for polygons
def generate_polygon(max_sides, max_length, start_x, start_y):
    points = [{'x': start_x, 'y': start_y}]
    for _ in range(max_sides - 1):
        angle = random.uniform(0, 2 * math.pi)
        dx = math.cos(angle) * random.uniform(0, max_length)
        dy = math.sin(angle) * random.uniform(0, max_length)
        new_point = {'x': points[-1]['x'] + dx, 'y': points[-1]['y'] + dy}
        points.append(new_point)
    return points

# Add polygons with limited side lengths
for _ in range(55):
    # Random start position
    start_x = random.uniform(10, 40)
    start_y = random.uniform(10, 40)
    # Generate a polygon with 3 to 6 sides and a maximum side length of 4 units
    polygon_points = generate_polygon(max_sides=random.randint(3, 6), max_length=4, start_x=start_x, start_y=start_y)

    # Add polygon to the series
    polygon_figure = polygon_series.add(polygon_points)

    # Set random stroke color, thickness, and fill color for each polygon
    stroke_color = (random.randint(0, 255), random.randint(0, 255), random.randint(0, 255))
    fill_color = (random.randint(0, 255), random.randint(0, 255), random.randint(0, 255), random.randint(50, 150))
    polygon_figure.set_stroke(thickness=random.uniform(1, 3), color=stroke_color)
    polygon_figure.set_color(color=fill_color)

chart.open()
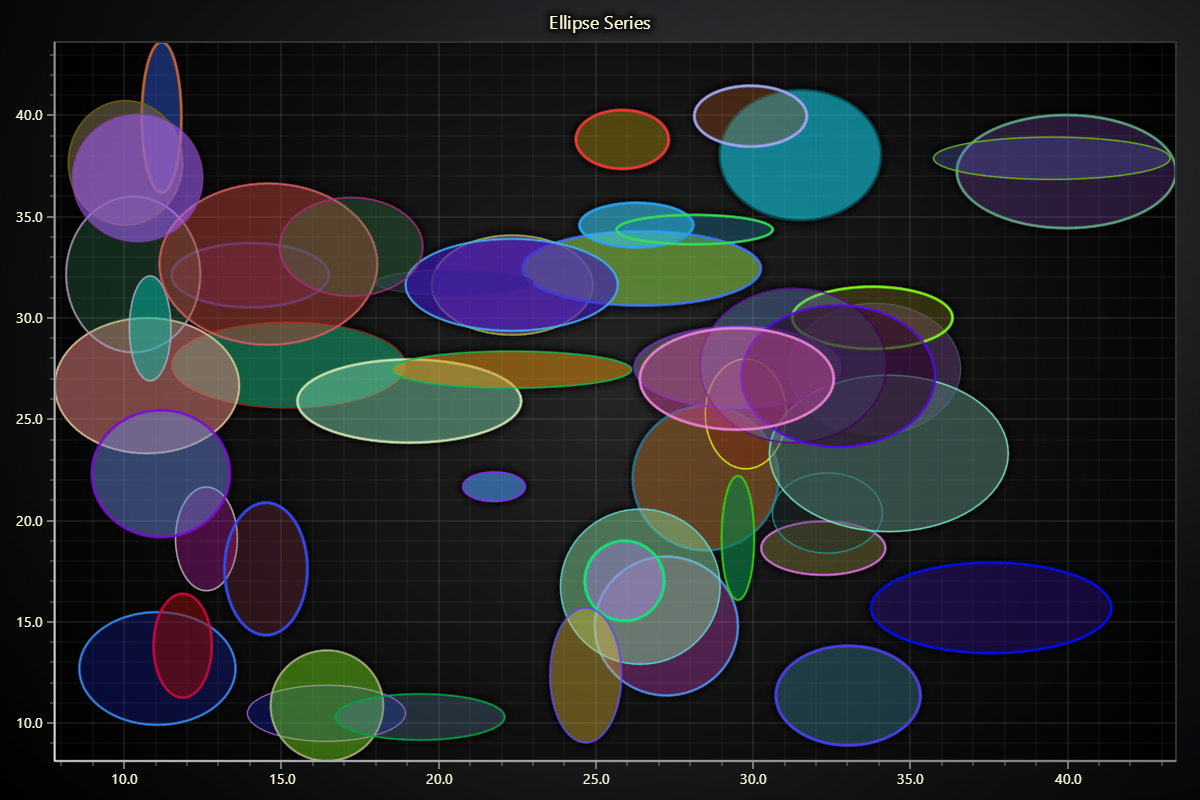
Ellipse Series
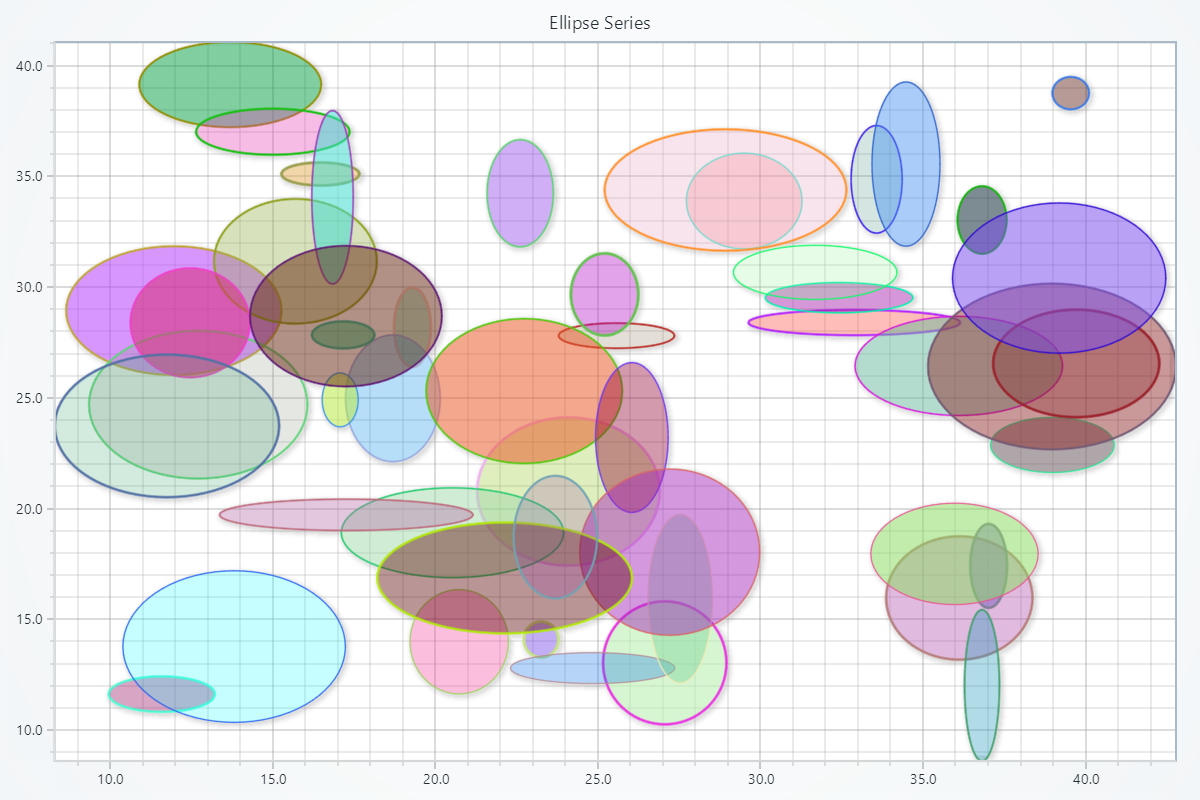
import lightningchart as lc
import random

# Set the license key
lc.set_license('my-license-key')

# Create a chart
chart = lc.ChartXY(
    title="Ellipse Series",
    theme=lc.Themes.Light
)

# Add an ellipse series
ellipse_series = chart.add_ellipse_series()

# Function to generate random ellipses
def generate_ellipse(max_radius_x, max_radius_y, center_x, center_y):
    radius_x = random.uniform(0.5, max_radius_x)
    radius_y = random.uniform(0.5, max_radius_y)
    return center_x, center_y, radius_x, radius_y

# Add ellipses
for _ in range(50):
    # Random center position
    center_x = random.uniform(10, 40)
    center_y = random.uniform(10, 40)

    # Generate an ellipse
    center_x, center_y, radius_x, radius_y = generate_ellipse(max_radius_x=4, max_radius_y=4, center_x=center_x, center_y=center_y)

    # Add ellipse to the series
    ellipse_figure = ellipse_series.add(center_x, center_y, radius_x, radius_y)

    # Set random stroke color, thickness, and fill color for each ellipse
    stroke_color = (random.randint(0, 255), random.randint(0, 255), random.randint(0, 255))
    fill_color = (random.randint(0, 255), random.randint(0, 255), random.randint(0, 255), random.randint(50, 150))
    ellipse_figure.set_stroke(thickness=random.uniform(1, 3), color=stroke_color)
    ellipse_figure.set_color(color=fill_color)

chart.open()
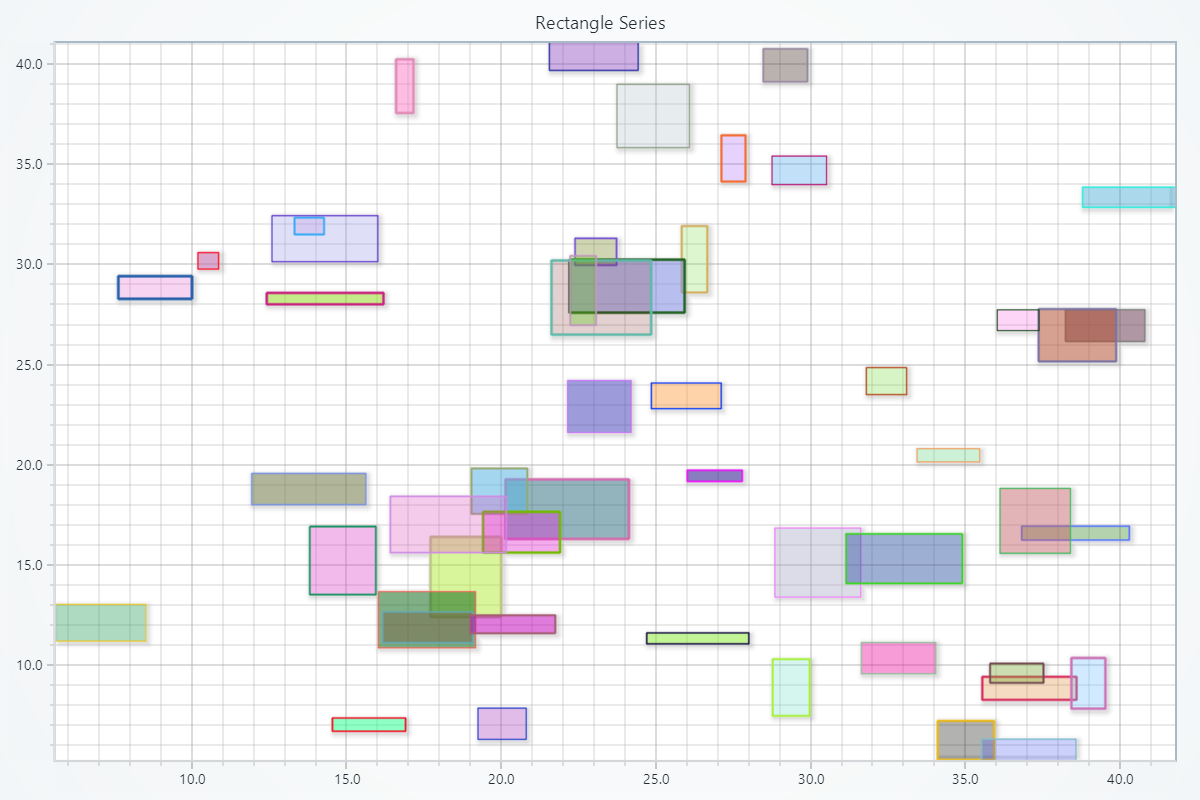
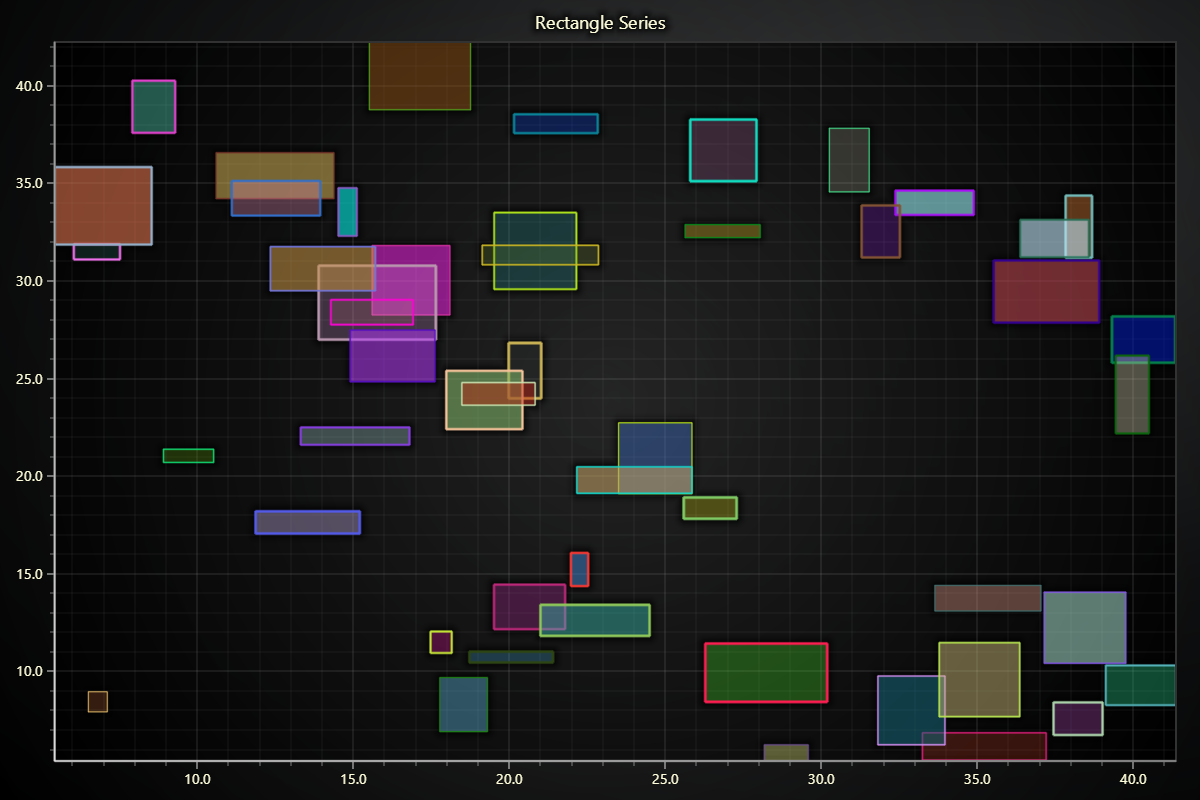
Rectangle Series
import lightningchart as lc
import random

# Set the license key
lc.set_license('my-license-key')

# Create a chart
chart = lc.ChartXY(
    title="Rectangle Series",
    theme=lc.Themes.Light
)

# Add a rectangle series
rectangle_series = chart.add_rectangle_series()

# Generate random rectangles
def generate_rectangle(max_width, max_height, x1, y1):
    width = random.uniform(0.5, max_width)
    height = random.uniform(0.5, max_height)
    return x1, y1, x1 + width, y1 + height

# Add rectangles with limited size
for _ in range(50):
    x1 = random.uniform(5, 40)
    y1 = random.uniform(5, 40)

    # Generate a rectangle with a maximum width and height of 4 units
    x1, y1, x2, y2 = generate_rectangle(max_width=4, max_height=4, x1=x1, y1=y1)

    # Add rectangle to the series
    rectangle_figure = rectangle_series.add(x1, y1, x2, y2)

    # Set random stroke color, thickness, and fill color for each rectangle
    stroke_color = (random.randint(0, 255), random.randint(0, 255), random.randint(0, 255))
    fill_color = (random.randint(0, 255), random.randint(0, 255), random.randint(0, 255), random.randint(50, 150))
    rectangle_figure.set_stroke(thickness=random.uniform(1, 3), color=stroke_color)
    rectangle_figure.set_color(color=fill_color)

chart.open()
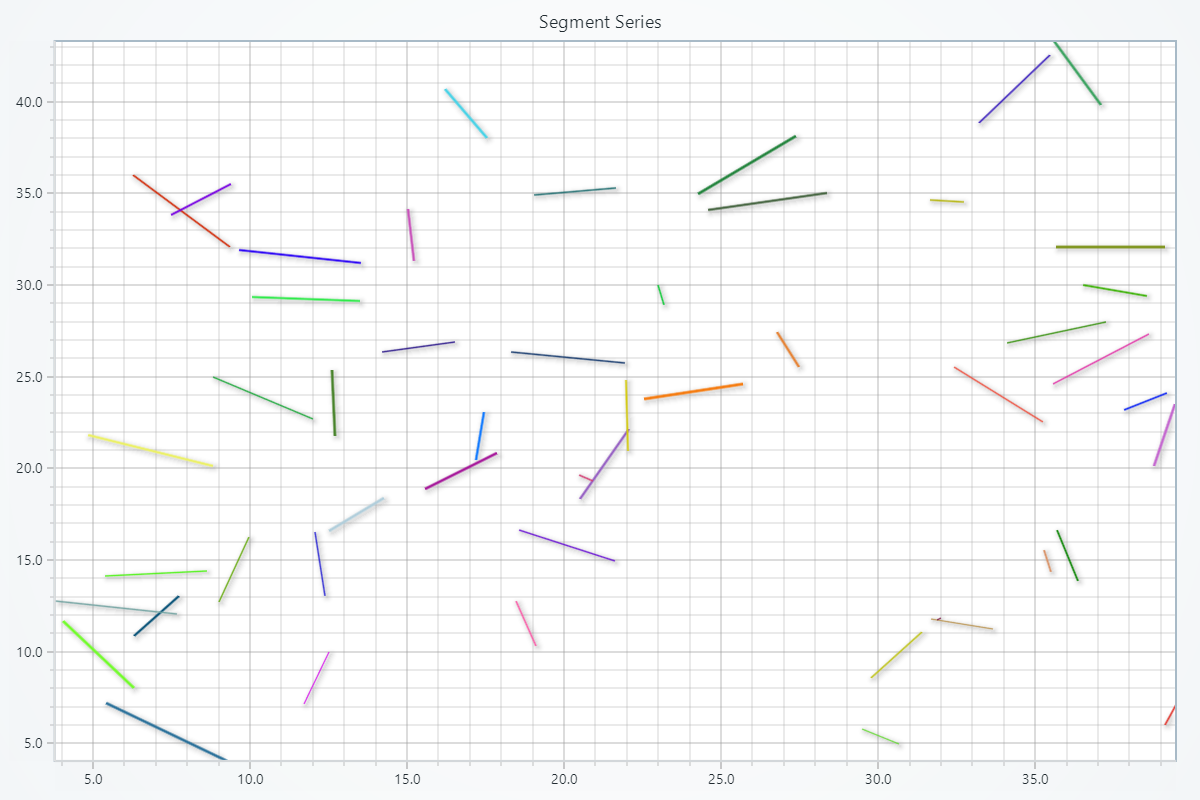
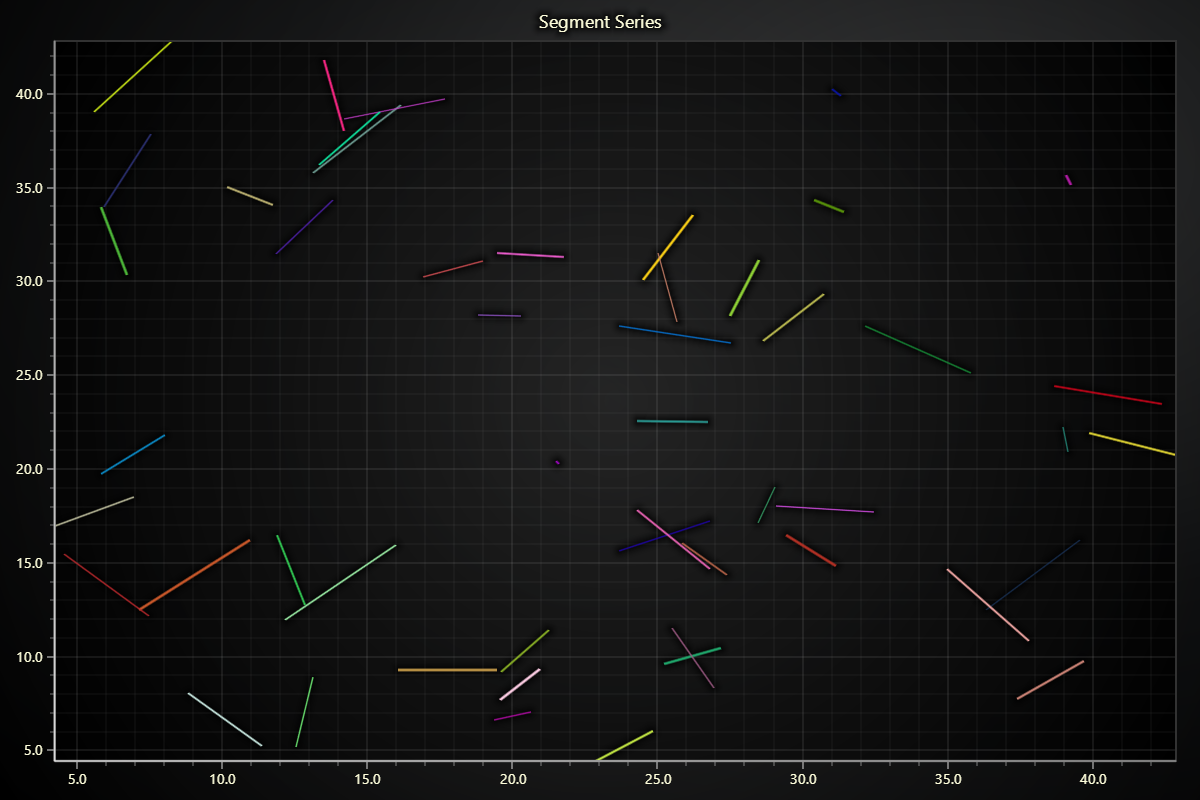
Segment Series
import lightningchart as lc
import random

# Set the license key
lc.set_license('my-license-key')

# Create a chart
chart = lc.ChartXY(
    title="Segment Series",
    theme=lc.Themes.Light
)

# Add a segment series
segment_series = chart.add_segment_series()

# Generate random segments
def generate_segment(max_length, x1, y1):
    length_x = random.uniform(-max_length, max_length)
    length_y = random.uniform(-max_length, max_length)
    return x1, y1, x1 + length_x, y1 + length_y

# Add segments with limited length
for _ in range(50):
    x1 = random.uniform(5, 40)
    y1 = random.uniform(5, 40)

    # Generate a segment with a maximum length of 4 units
    x1, y1, x2, y2 = generate_segment(max_length=4, x1=x1, y1=y1)

    # Add segment to the series
    segment_figure = segment_series.add_segment(x1, y1, x2, y2)

    # Set random stroke color and thickness for each segment
    stroke_color = (random.randint(0, 255), random.randint(0, 255), random.randint(0, 255))
    segment_figure.set_stroke(thickness=random.uniform(1, 3), color=stroke_color)

chart.open()
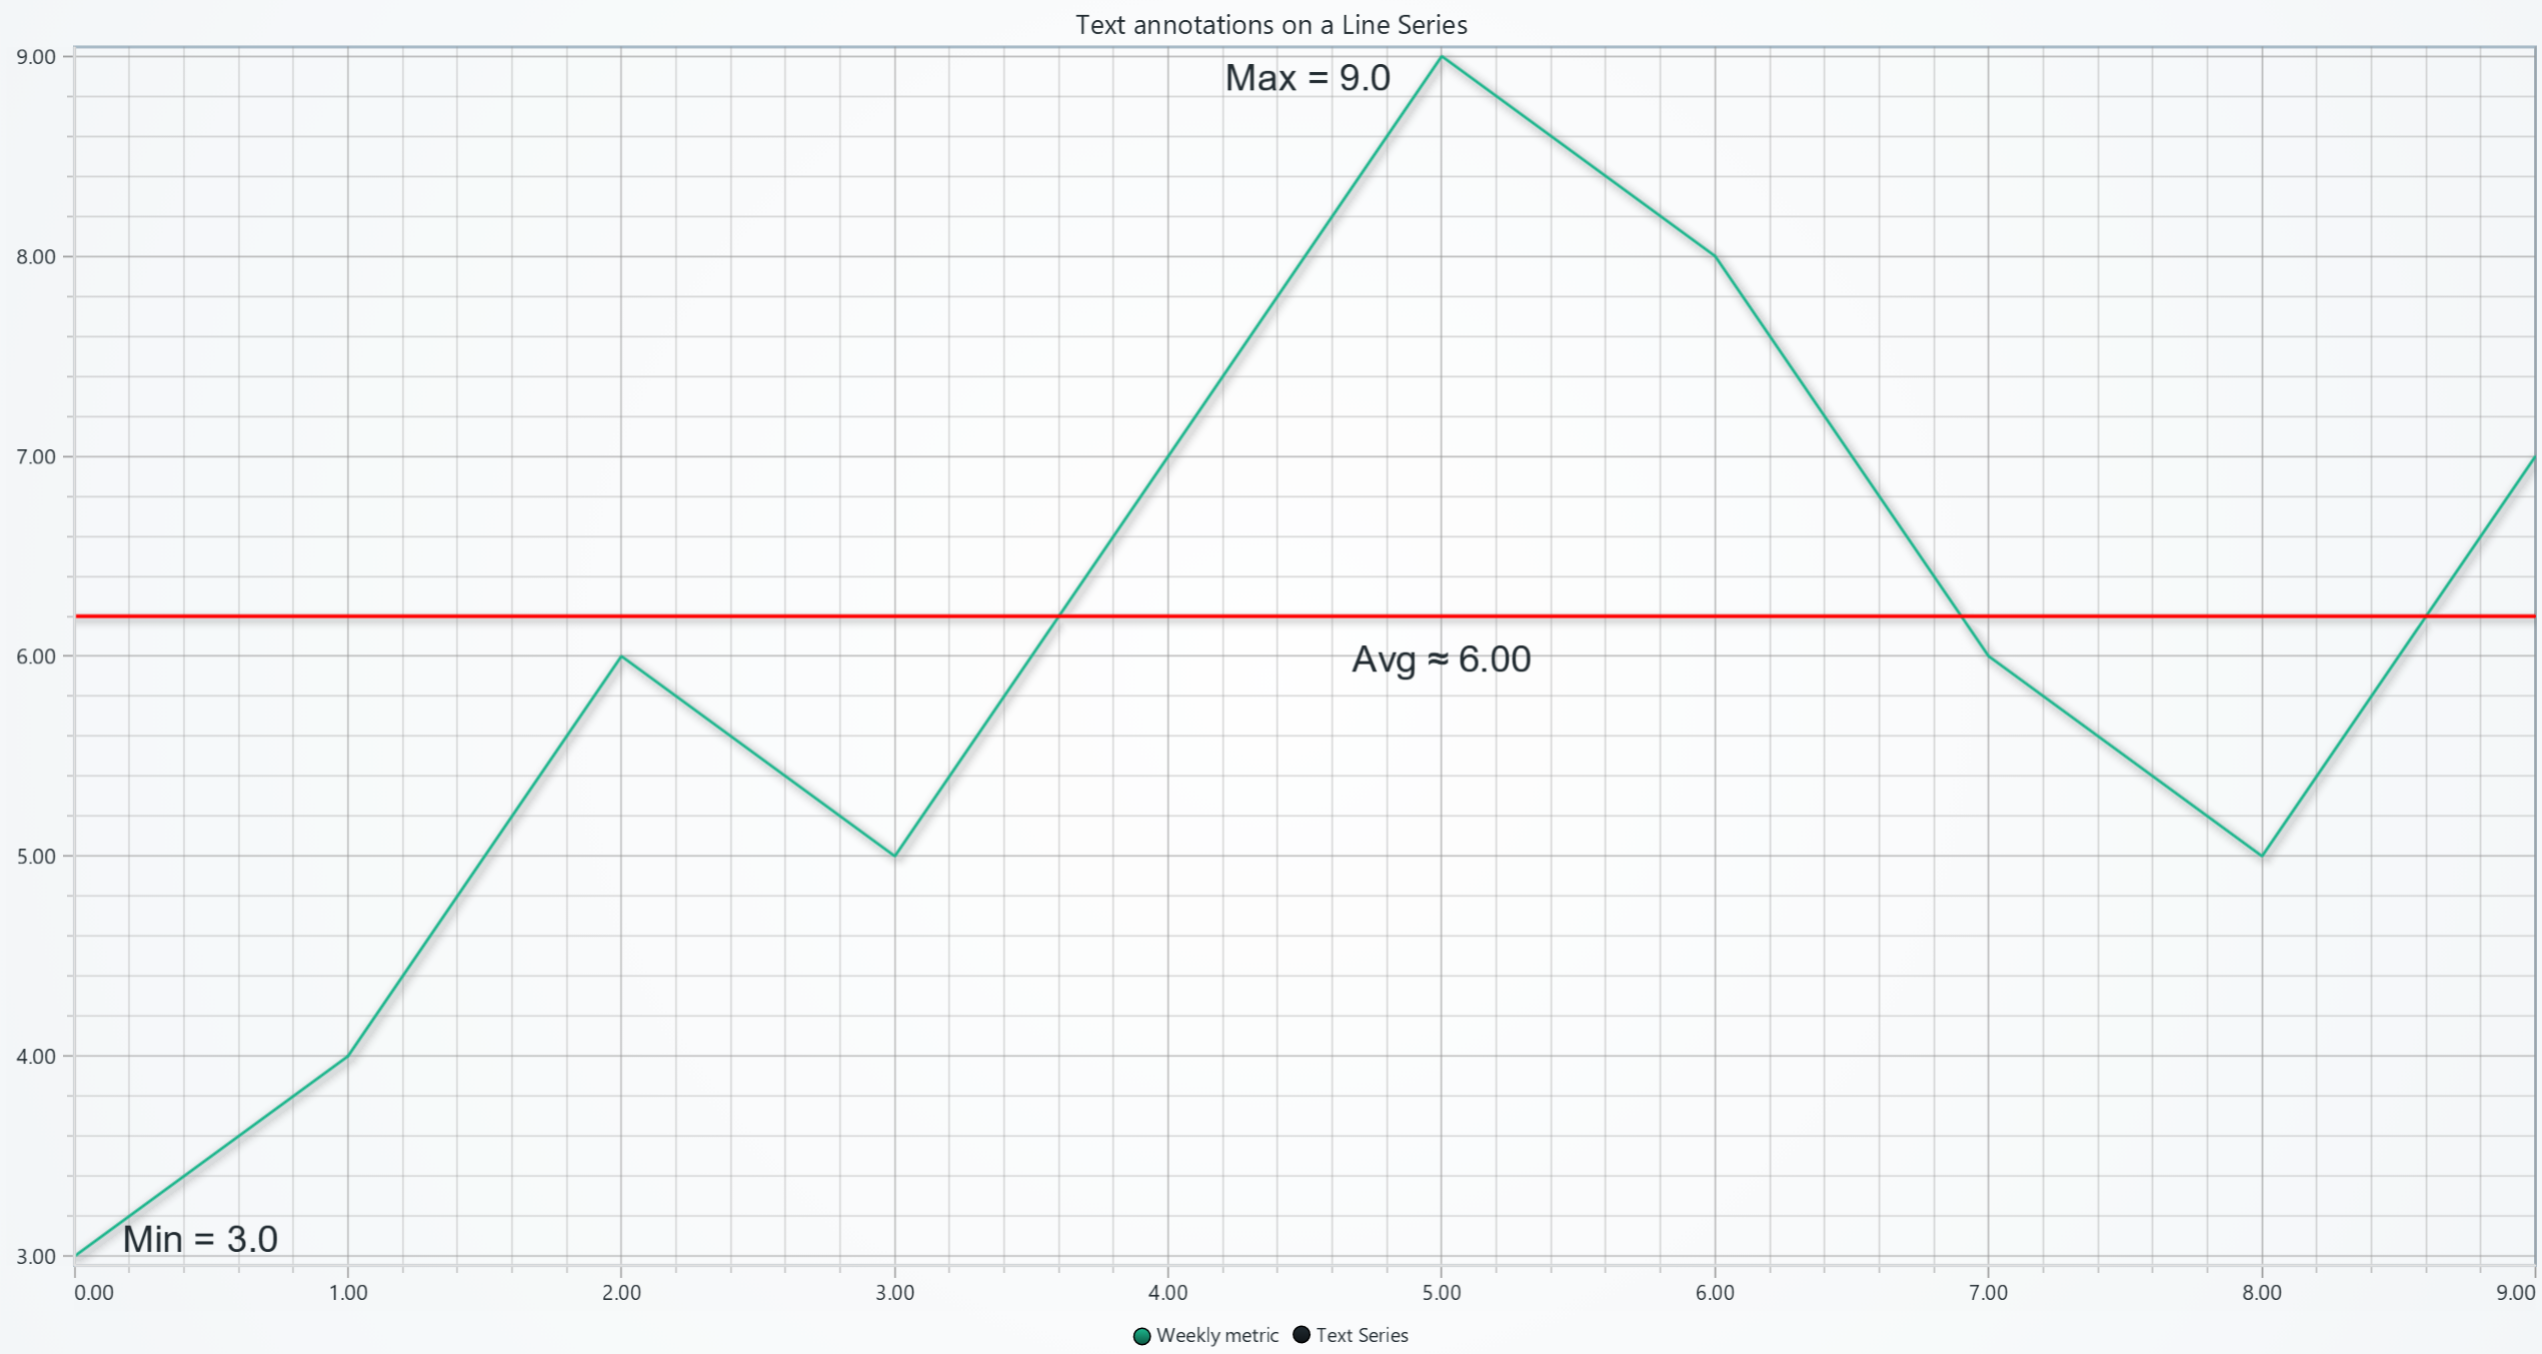
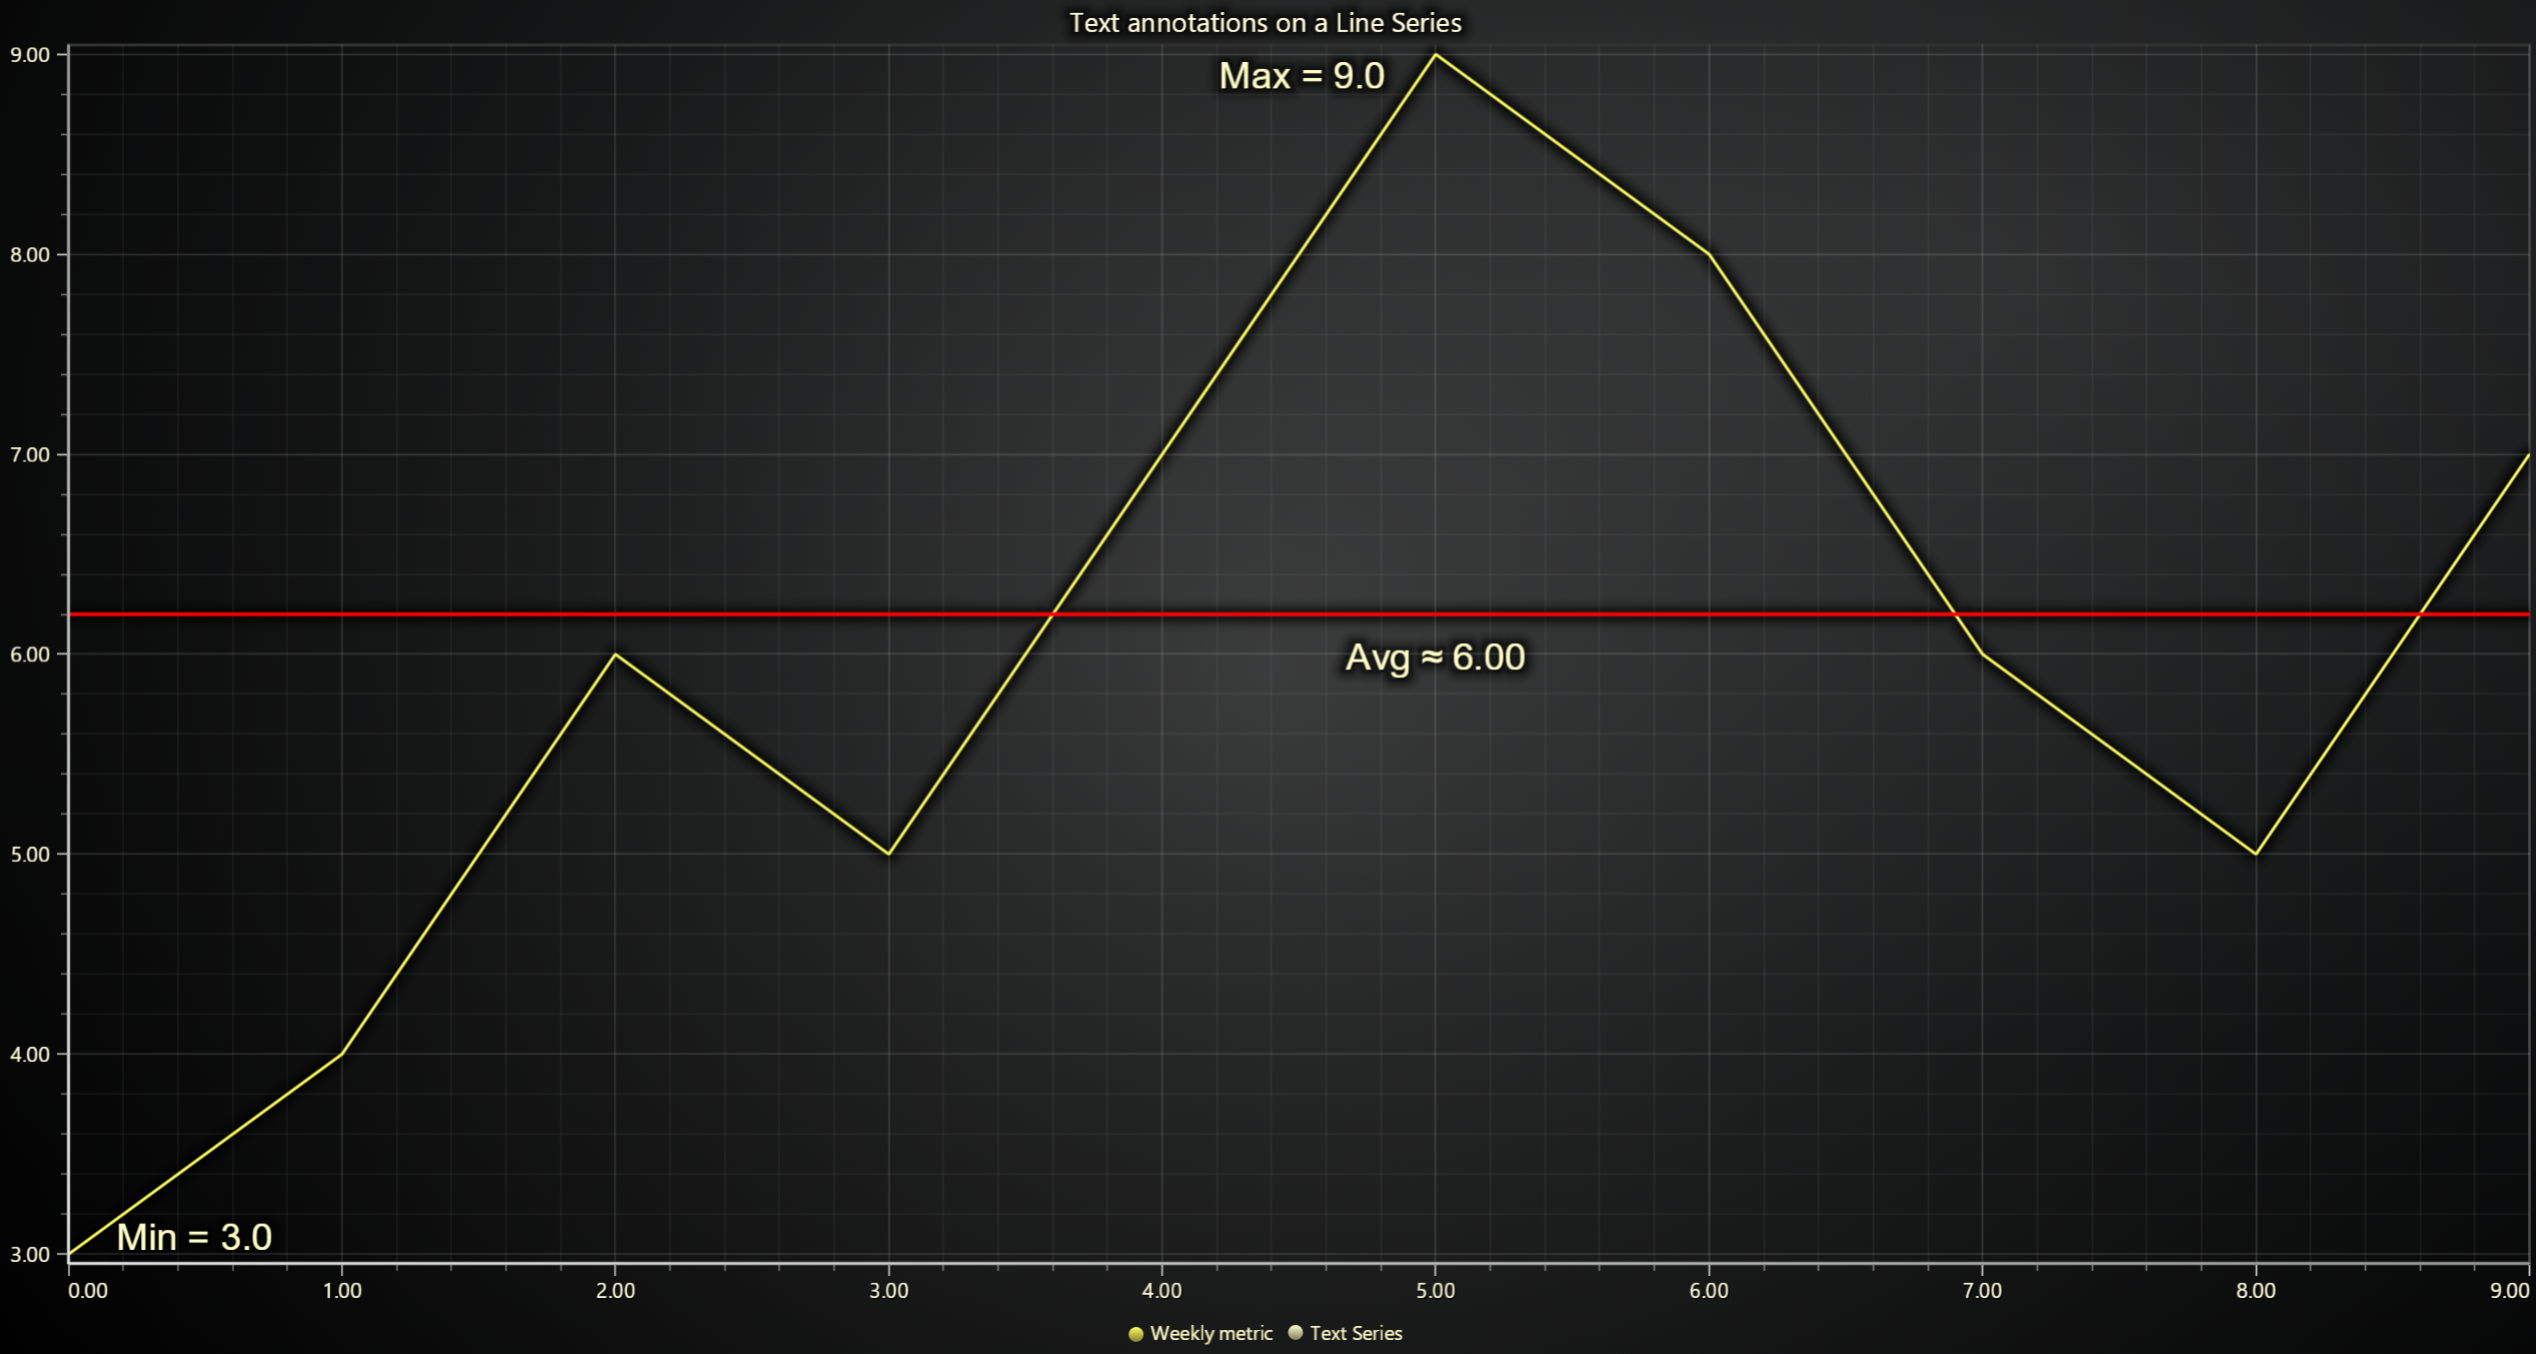
Text Series
import lightningchart as lc
import statistics

lc.set_license('my-license-key')

x = list(range(10))
y = [3, 4, 6, 5, 7, 9, 8, 6, 5, 7]

# Create Chart & line series
chart = lc.ChartXY(theme=lc.Themes.Light, title='Text annotations on a Line Series')
chart.set_series_background_color((0, 0, 0, 0))
line = chart.add_line_series().add(x, y)

# Calculate statistics
y_min = min(y); x_min = x[y.index(y_min)]
y_max = max(y); x_max = x[y.index(y_max)]
y_avg = statistics.fmean(y)

y_axis = chart.get_default_y_axis()

# Create text series for annotations
text_series = chart.add_text_series()

# "Min" label using text series
min_label = text_series.add(
    x=x_min,
    y=y_min,
    text=f"Min = {y_min:.1f}",
    alignment_x=-1.5,
    alignment_y=-0.9
).set_font(size=25)


# "Max" label using text series
max_label = text_series.add(
    x=x_max,
    y=y_max,
    text=f"Max = {y_max:.1f}",
    alignment_x=1.5,
    alignment_y=1.05
).set_font(size=25)

# "Average" guide with label
avg_label = text_series.add(
    x=x_max,
    y=y_avg,
    text=f"Avg ≈ {y_avg:.2f}",
    alignment_x=0,
    alignment_y=0.25
).set_font(size=25)
constant_line_min = y_axis.add_constant_line()
constant_line_min.set_value(y_avg+0.2).set_line_thickness(2.5).set_line_color((255, 0, 0))

line.set_name('Weekly metric')
chart.open()