Scrolling Surface
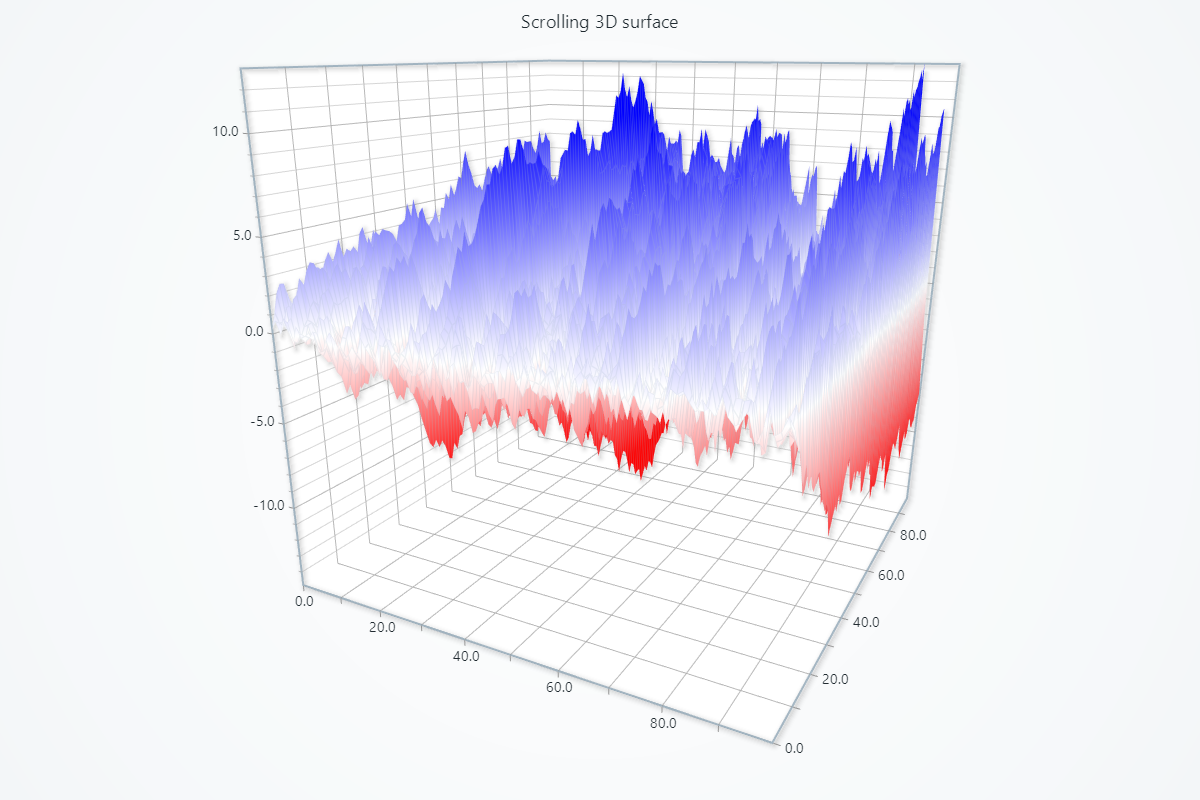
Scrolling 3D Surface
Series for visualizing a 3D Surface Grid inside Chart3D, with API for pushing data in a scrolling manner (append new data on top of existing data).
import lightningchart as lc
import random
import time
# Set your license key here
lc.set_license('my-license-key')
# Define the grid size
columns_amount = 100
rows_amount = 100
# Generate initial surface data
surface_data = []
for i in range(rows_amount):
row = []
value = 0
for j in range(columns_amount):
value += (random.random() * 2) - 1
row.append(value)
surface_data.append(row)
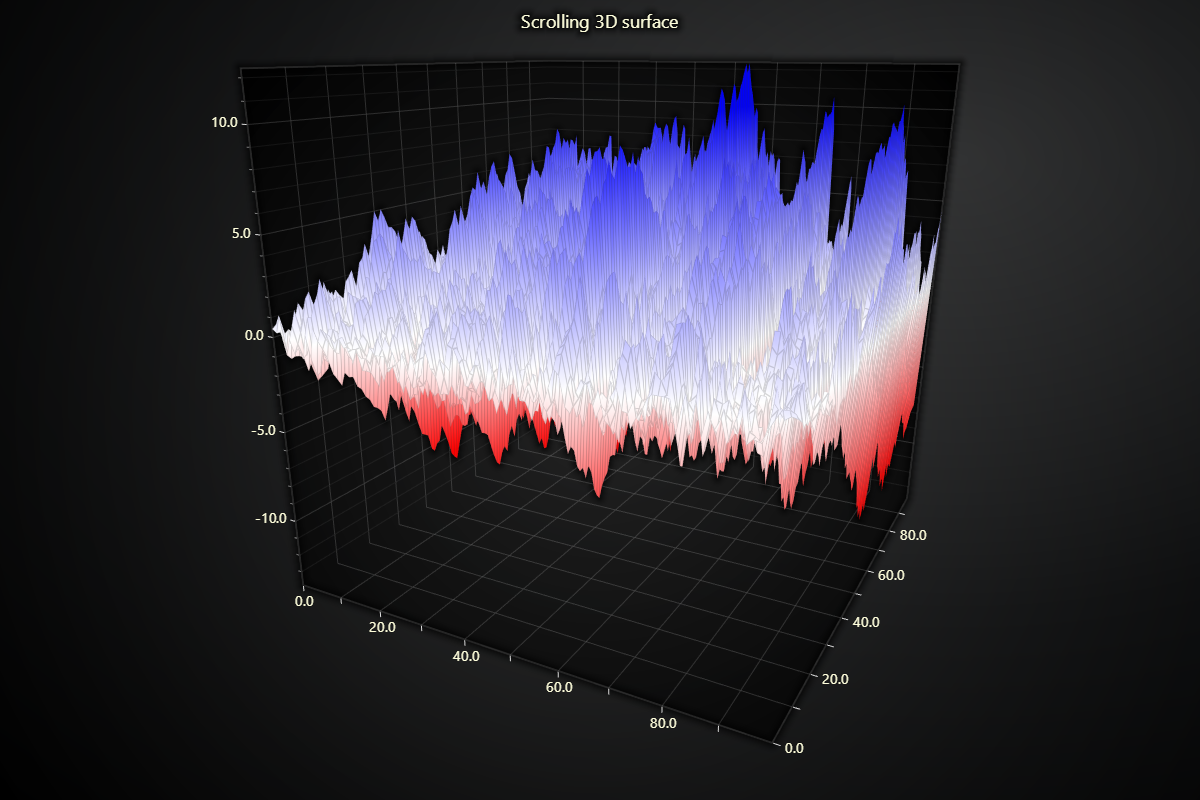
# Creating a 3D chart
chart = lc.Chart3D(
theme=lc.Themes.Dark,
title='Scrolling 3D surface'
)
# Add a scrolling surface grid series to the chart
series = chart.add_surface_scrolling_grid_series(
columns=columns_amount,
rows=rows_amount
)
# Set palette colors
series.set_palette_coloring(
steps=[
{'value': 10, 'color': ('blue')},
{'value': 0, 'color': ('white')},
{'value': -10, 'color': ('red')},
],
look_up_property='value',
percentage_values=False
)
# Initialize the series with the generated data
series.add_values(y_values=surface_data, intensity_values=surface_data)
# Open the chart in live mode
chart.open(live=True)
# Add new data to the series every 0.05 seconds
for _ in range(500):
new_row = []
for _ in range(columns_amount):
new_value = (random.random() * 2) - 1
new_row.append(new_value)
series.add_values(y_values=[new_row], intensity_values=[new_row])
time.sleep(0.05) # Adjust sleep
chart.close()
import lightningchart as lc
import random
import time
lc.set_license('my-license-key')
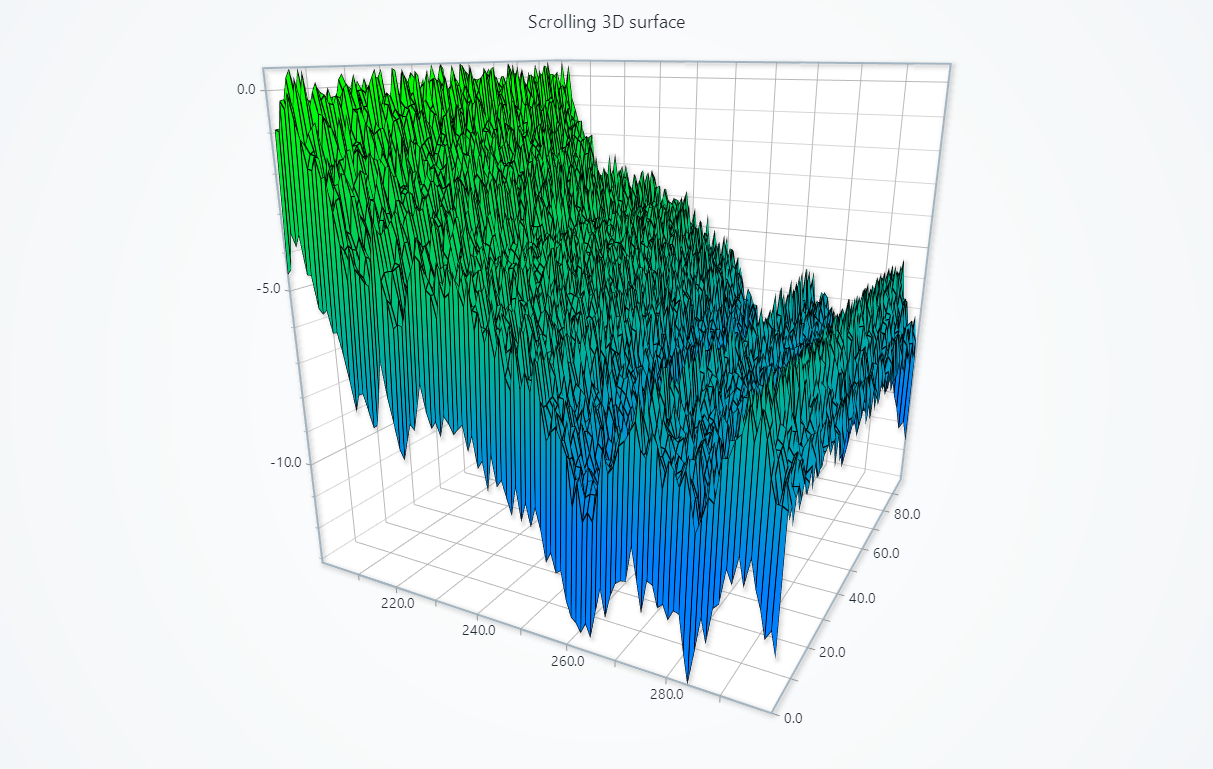
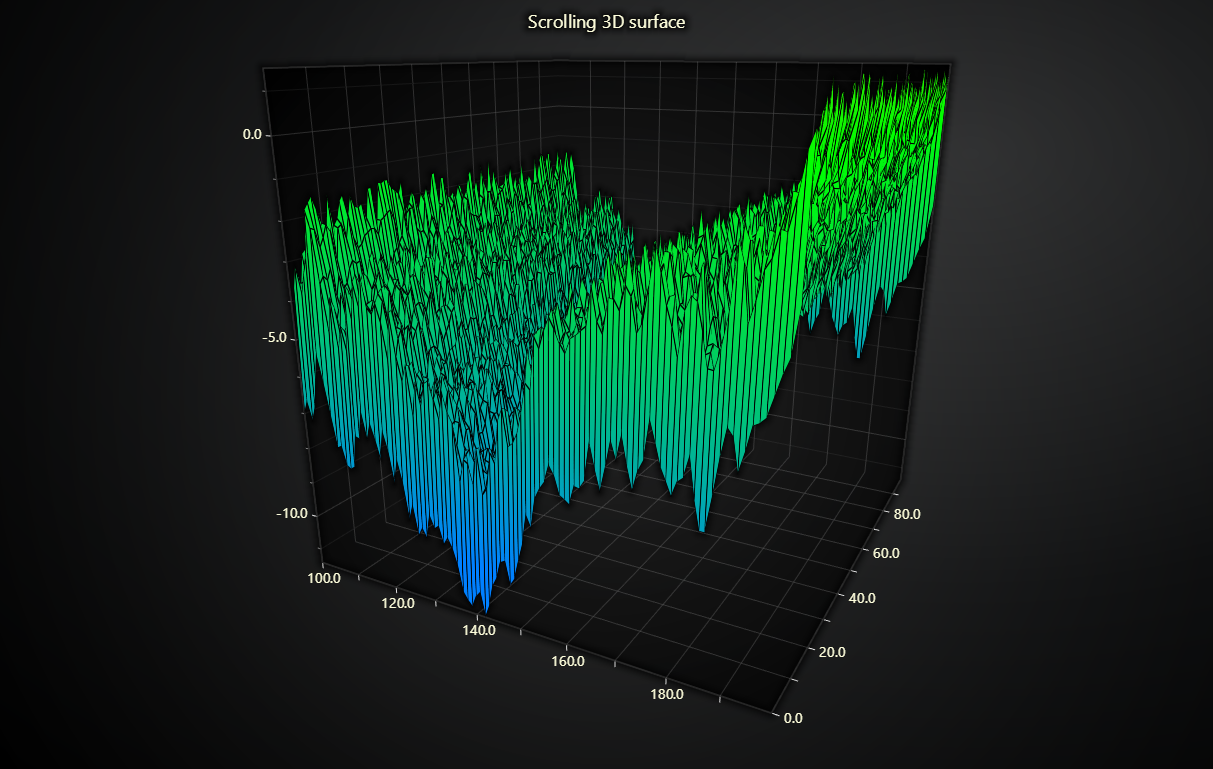
chart = lc.Chart3D(title='Scrolling 3D surface', theme=lc.Themes.Light)
# Configure scrolling axis
axis = chart.get_default_x_axis()
axis.set_scroll_strategy(strategy='scrolling')
axis.set_interval(start=-99, end=0, stop_axis_after=False)
# Configure scrolling surface series
surface = chart.add_surface_scrolling_grid_series(columns=100, rows=100)
surface.set_wireframe_stroke(1, color=(0, 0, 0, 255))
# Configure surface coloring
surface.set_palette_coloring(
steps=[
{'value': -10, 'color': (0, 128, 255)},
{'value': 0, 'color': (0, 255, 0)},
{'value': 10, 'color': (255, 128, 0)},
],
look_up_property='y', # Datapoints are colored according to their y value
percentage_values=False
)
chart.open(live=True)
x = 0
for i in range(1000): # Generate random real-time data
x = x + (random.random() * 2) - 1
datagrid = [[x + random.uniform(0, 1) for j in range(100)]]
datagrid[0][0] = datagrid[0][-1] = x - 3
surface.add_values(datagrid) # Add values to the series
time.sleep(0.01)
chart.close()