3D Scatter points
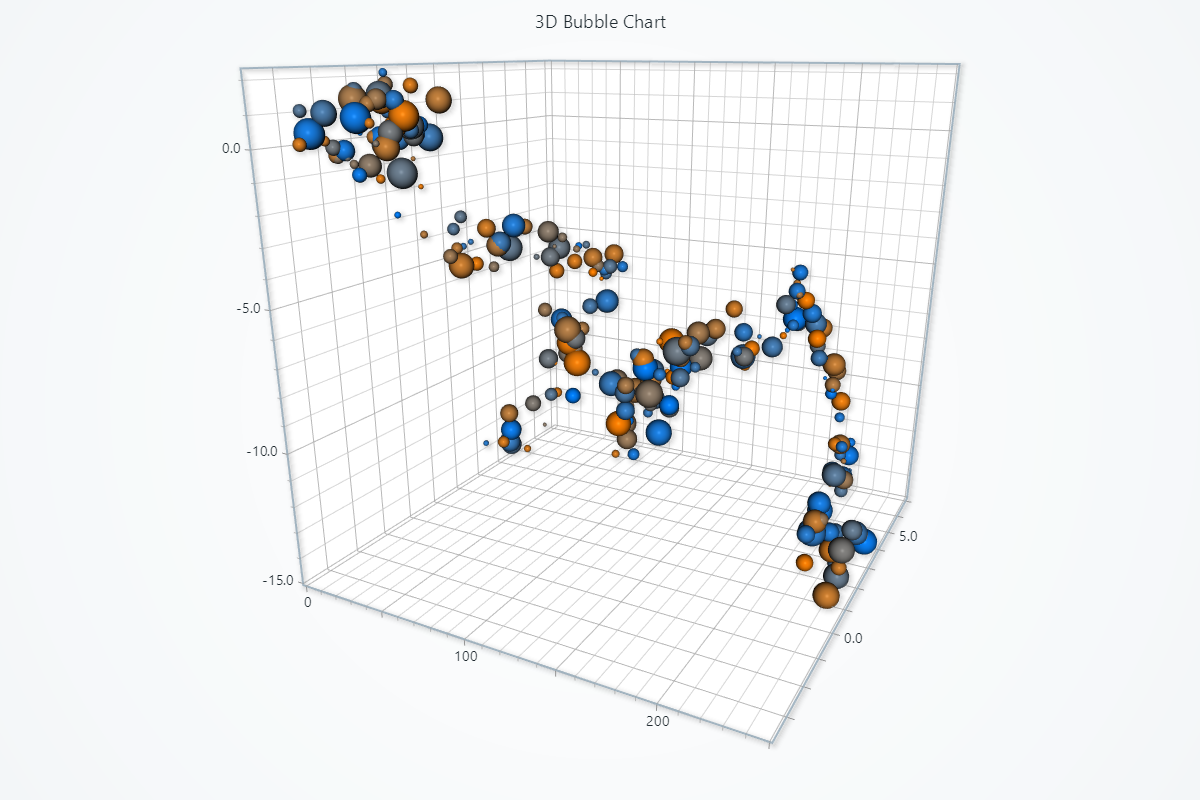
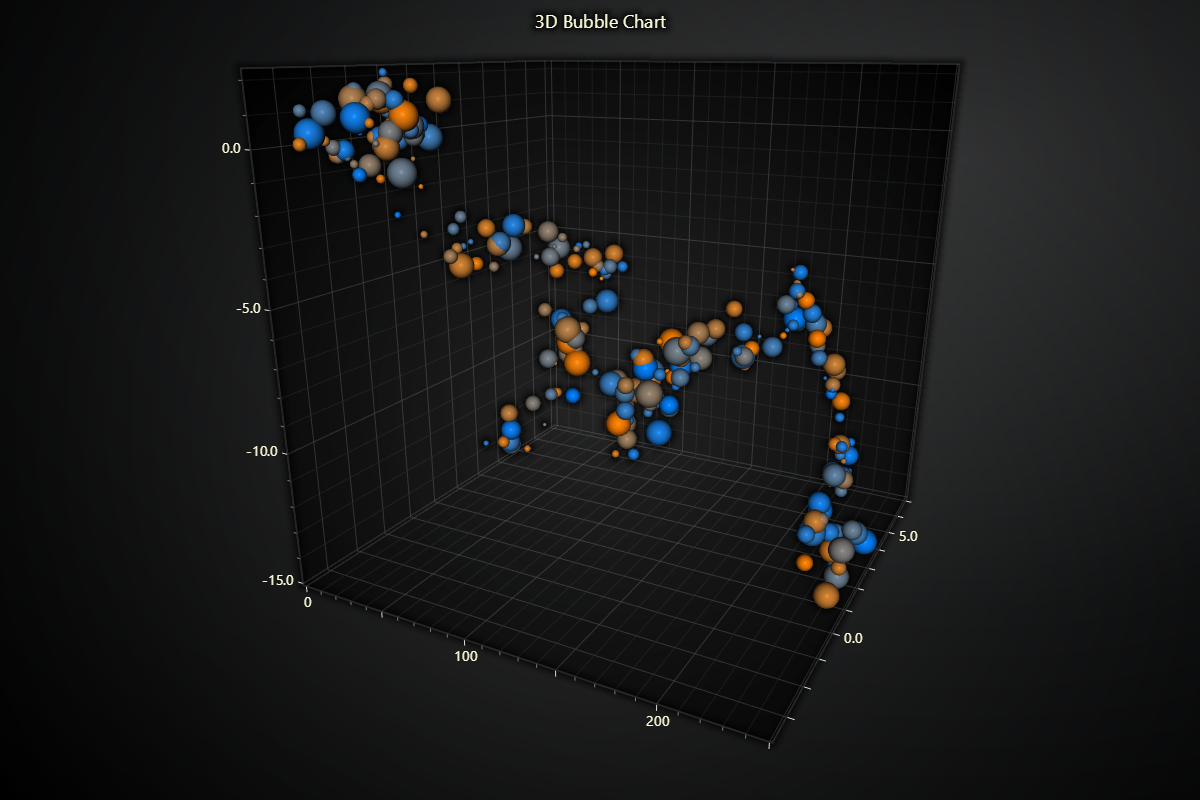
Bubble chart
import lightningchart as lc
import random

lc.set_license('my-license-key')

chart = lc.Chart3D(
    theme=lc.Themes.Light,
    title='3D Bubble Chart'
)

series = chart.add_point_series(
    render_2d=False,
    individual_lookup_values_enabled=True,
    individual_point_color_enabled=True,
    individual_point_size_axis_enabled=True,
    individual_point_size_enabled=True,
)
series.set_point_shape('sphere')
series.set_palette_point_colors(
    steps=[
        {'value': 0.0, 'color': (255, 128, 0)},
        {'value': 1.0, 'color': (0, 128, 255)},
    ],
    look_up_property='value',
    interpolate=True,
    percentage_values=True
)

data = []
y, z = 0, 0
for x in range(250):
    y += (random.random() * 2) - 1
    z += (random.random() * 2) - 1
    data.append({
        'x': x,
        'y': y,
        'z': z,
        'size': random.uniform(4, 32),
        'value': random.random()
    })
series.add(data)

chart.open()
Point Cloud
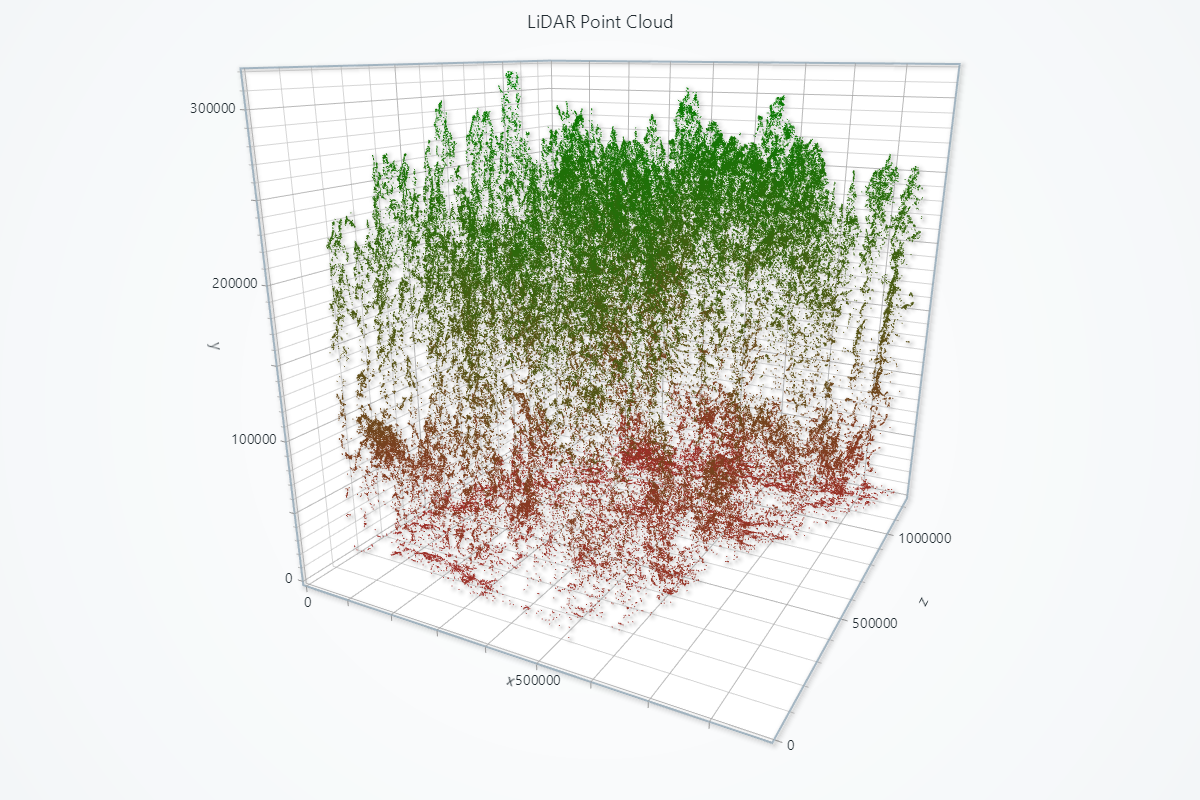
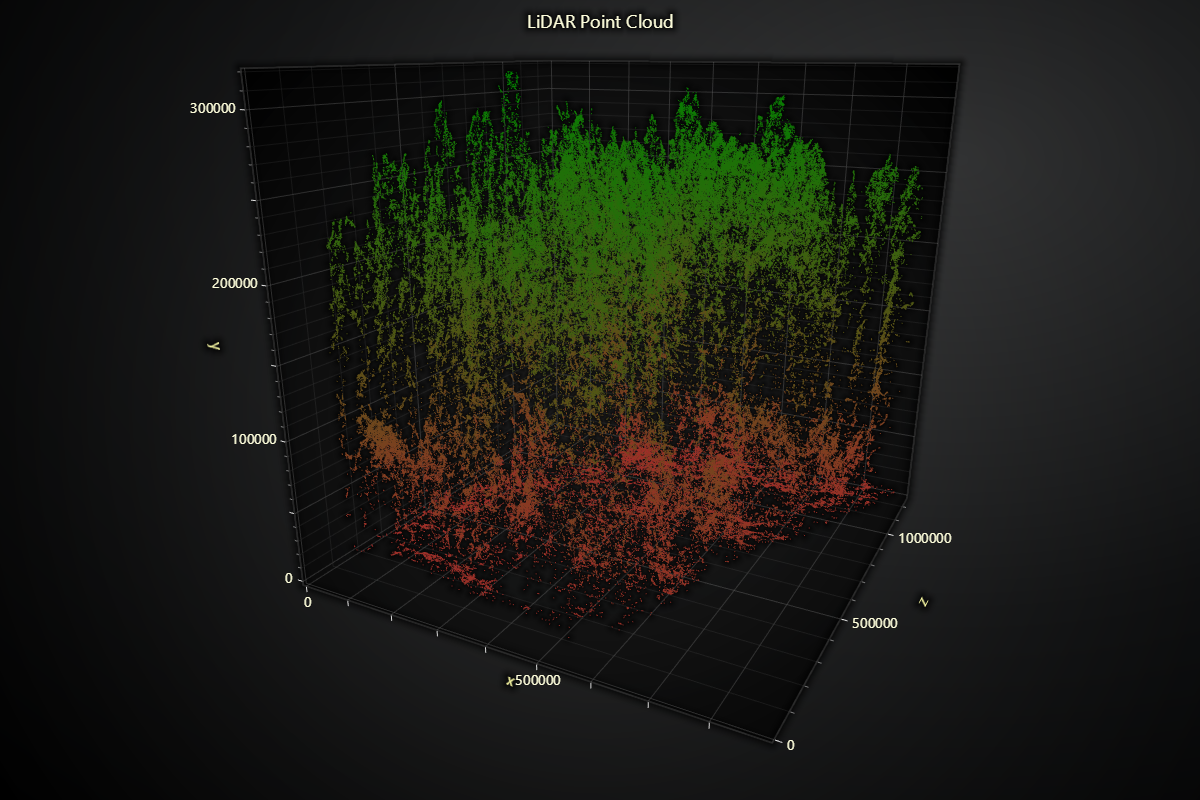
import laspy
import numpy as np
import lightningchart as lc

# Read the license key
lc.set_license('my-license-key')

# Function to read LAS file and extract X, Y, Z coordinates
def load_las_file(file_path):
    las = laspy.read(file_path)
    # Convert to native Python types to avoid serialization issues
    x = las.X.astype(float).tolist()
    y = las.Y.astype(float).tolist()
    z = las.Z.astype(float).tolist()
    return np.vstack((x, y, z)).T

# Load the LAS files for Plot 6
plot6 = load_las_file('Path to .las file')

# Normalize the point clouds to start from (0, 0, 0)
plot6 -= plot6.min(axis=0)

# Create a 3D chart
chart = lc.Chart3D(
    theme=lc.Themes.Dark,
    title='LiDAR Point Cloud'
)

# Add the second point cloud for Plot 6
series2 = chart.add_point_series(render_2d=True)
series2.add(plot6[:, 0], plot6[:, 2], plot6[:, 1])

# Color points based on elevation (y-axis)
series2.set_palette_point_colors(
    steps=[
        {'value': plot6[:, 2].min().item(), 'color': 'brown'},
        {'value': plot6[:, 2].max().item(), 'color': 'green'}
    ],
    look_up_property='y',
    percentage_values=False
)
series2.set_point_size(1)

# Set axis titles
x=chart.get_default_x_axis().set_title('x')
y=chart.get_default_y_axis().set_title('y')
z=chart.get_default_z_axis().set_title('z')

chart.open()