import lightningchart as lc
lc.set_license('my-license-key')
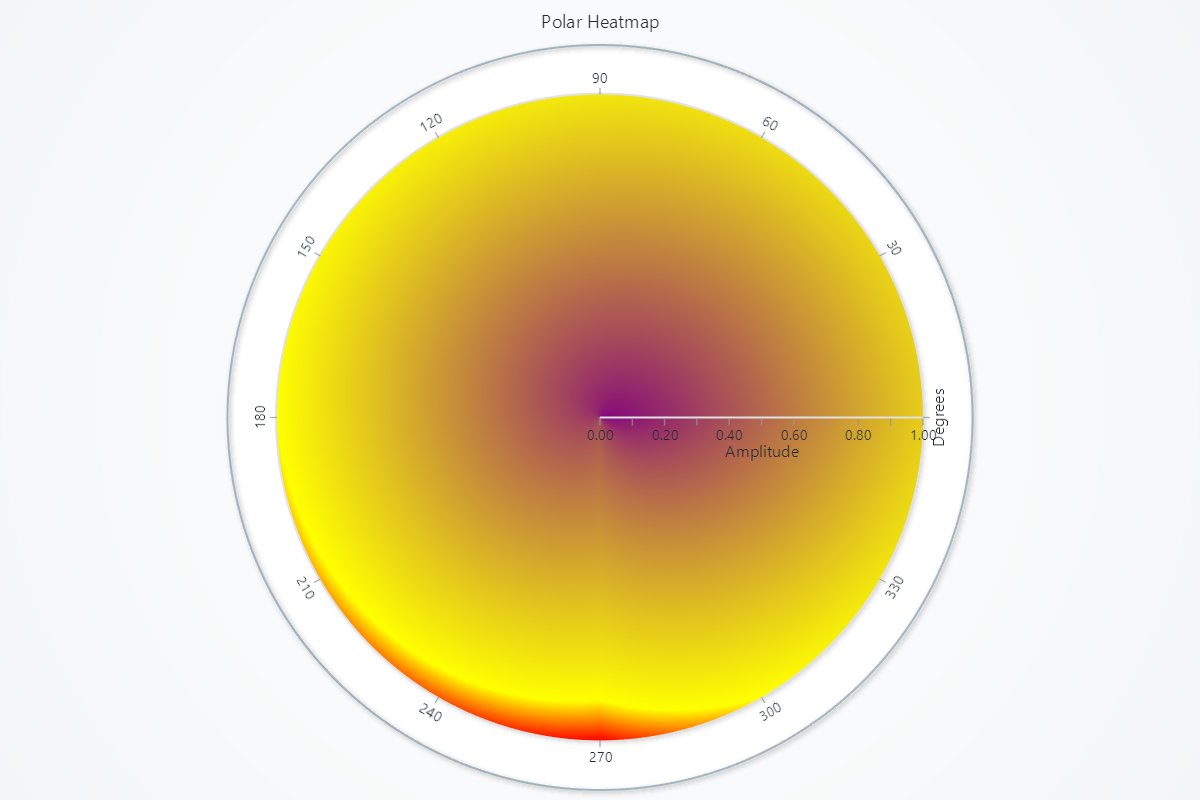
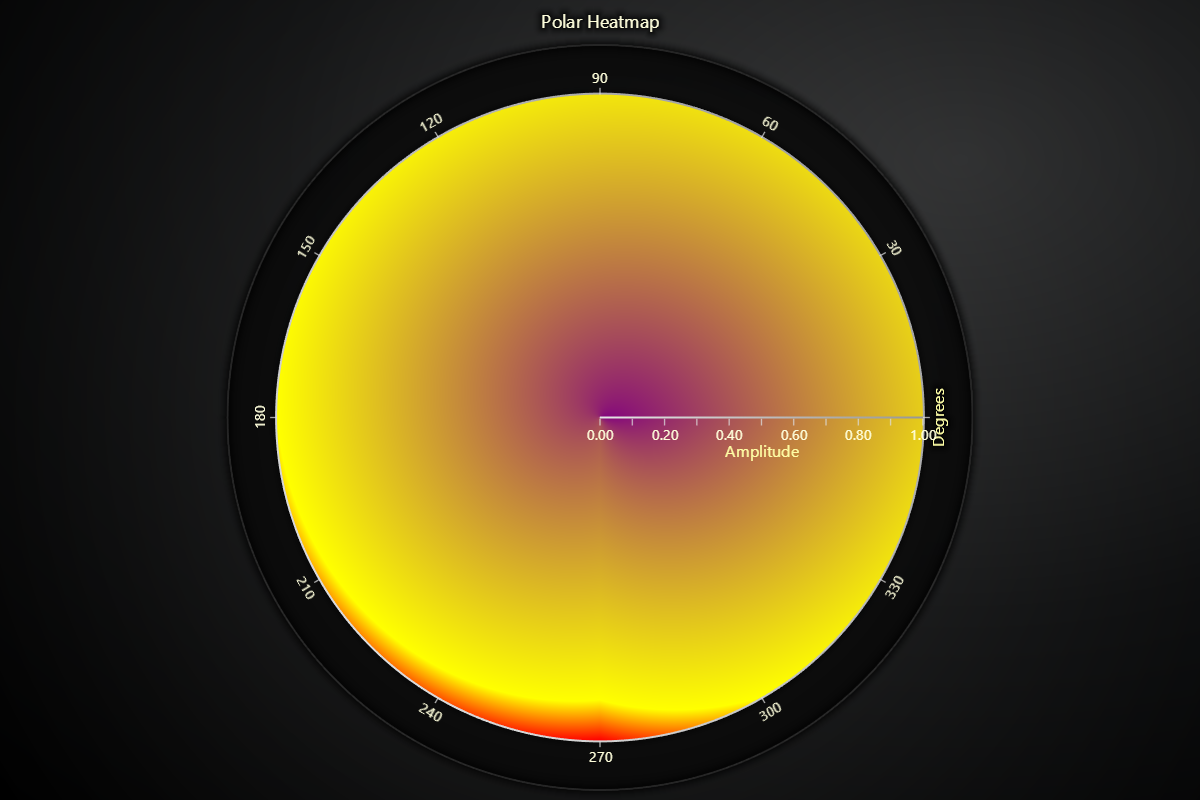
chart = lc.PolarChart(theme=lc.Themes.Light, title="Polar Heatmap")
heatmap_series = chart.add_heatmap_series(sectors=4, annuli=3)
intensity_values = [
[0, 1, 2, 3],
[4, 5, 6, 7],
[8, 9, 10, 11]
]
heatmap_series.invalidate_intensity_values(values=intensity_values, i_annulus=0, i_sector=0)
heatmap_series.set_palette_coloring(
steps=[
{'value': 0, 'color': ('purple')},
{'value': 10, 'color': ('yellow')},
{'value': 11, 'color': ('red')},
],
look_up_property='value',
interpolate=True
)
heatmap_series.set_intensity_interpolation('bilinear')
chart.open()