Polar lines
Polar Chart has two types of series for drawing lines:
Line Series
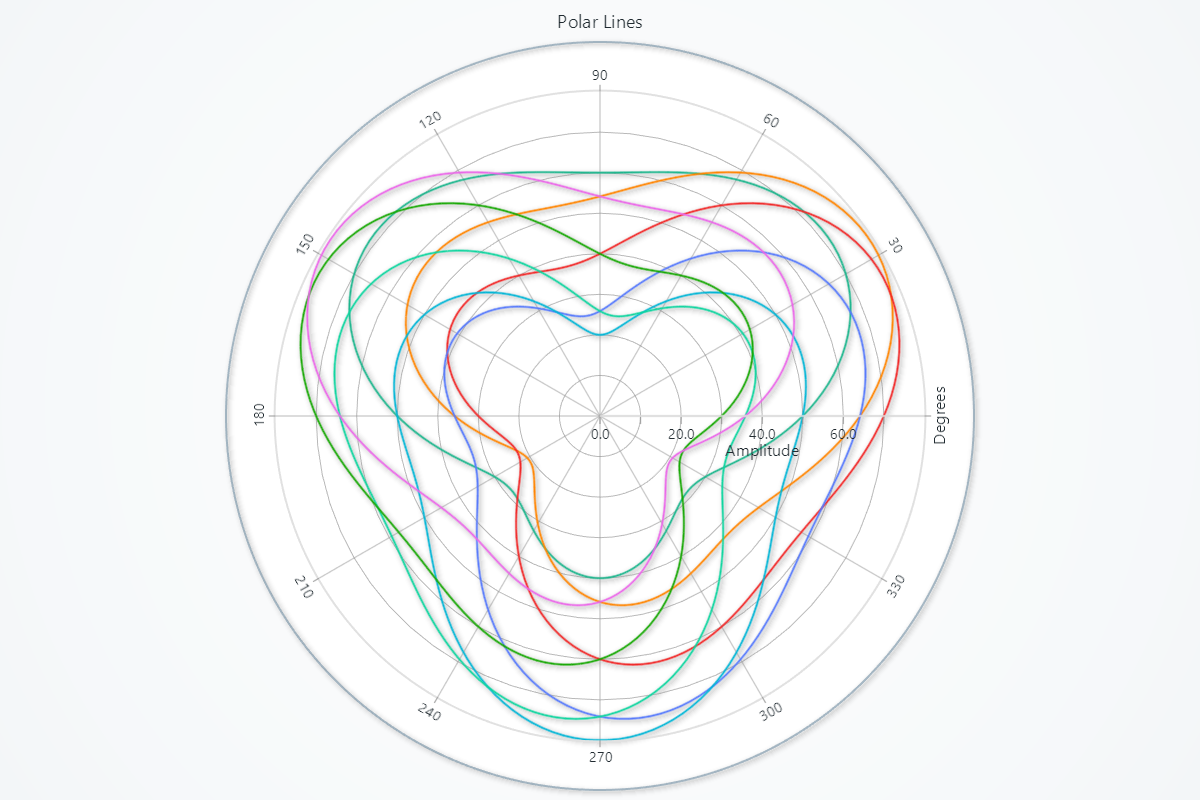
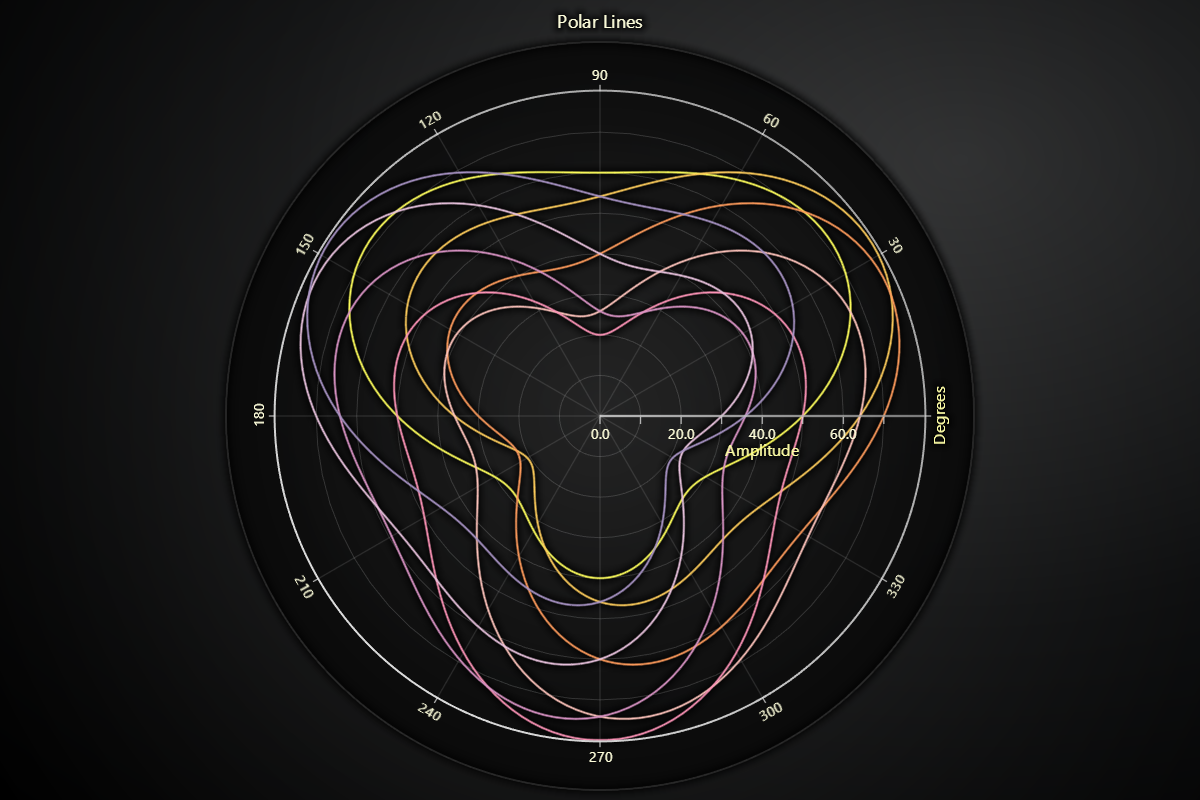
import lightningchart as lc
import numpy as np

# Set your license key here
lc.set_license('my-license-key')

# Create the polar chart
chart = lc.PolarChart(theme=lc.Themes.Light, title="Polar Line Series")

# Generate data points
angles = np.linspace(0, 360, 180)  # Angles from 0 to 360 degrees with 180 points

# Loop through frequencies and create lines
for i in range(8):
    # Create data for the line series using a sine wave function
    amplitudes = [50 + 20 * np.sin(np.radians(angle + i * 45)) + 10 * np.sin(np.radians(3 * angle)) for angle in angles]

    # Prepare data as list of dictionaries
    data = [{'angle': angle, 'amplitude': amp} for angle, amp in zip(angles, amplitudes)]

    # Add line series to the chart
    line_series = chart.add_line_series().set_data(data)

chart.open()
Point Line Series
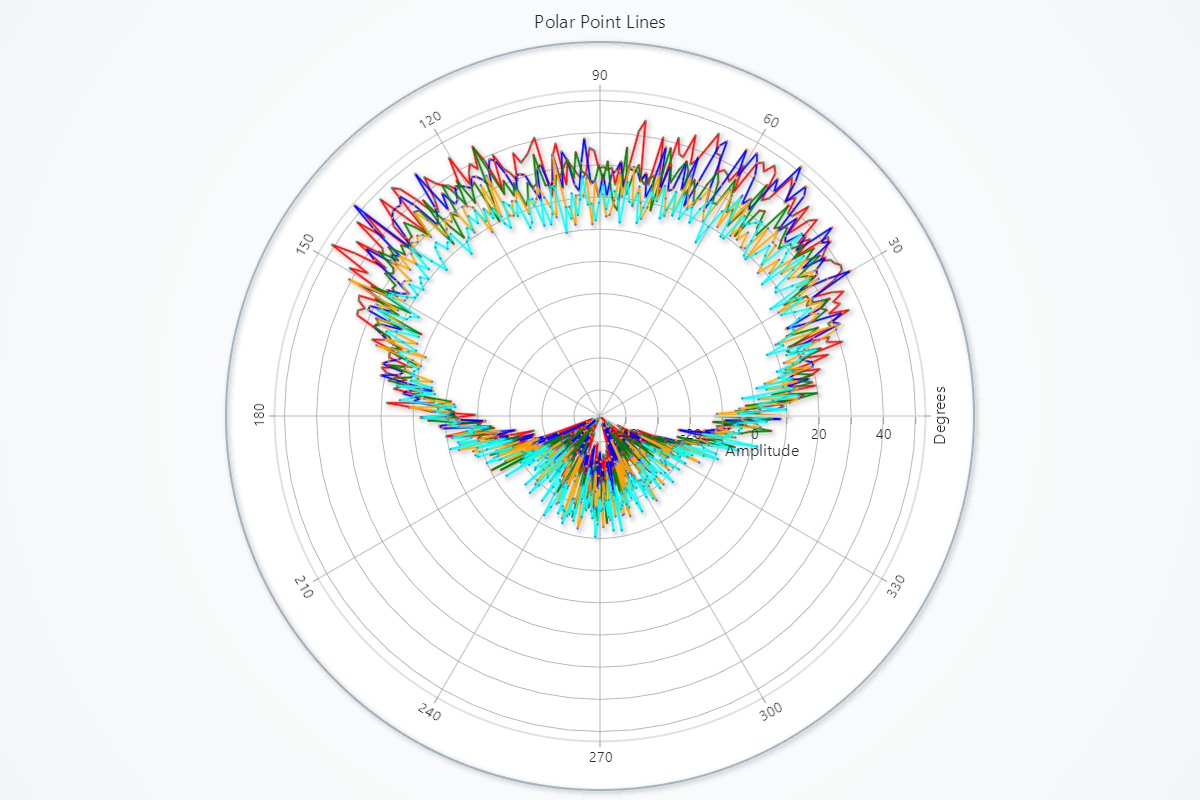
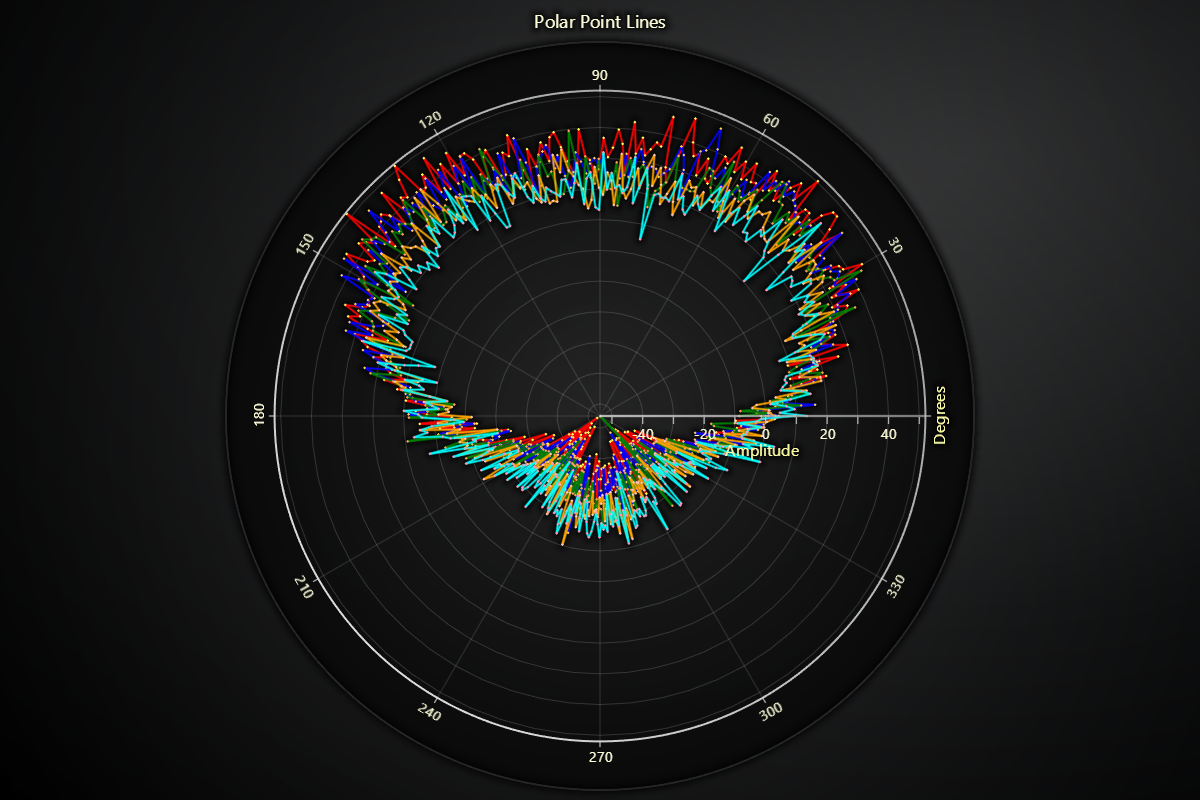
import lightningchart as lc
import numpy as np

# Set your license key here
lc.set_license('my-license-key')

# Create the polar chart
chart = lc.PolarChart(theme=lc.Themes.Light, title="Polar Point Line")

# Define the angle range
angles = np.linspace(0, 360, 360)

# Frequency or sensitivity data
sensitivity_data = [
    (0, 1, ('red')),
    (0, 0.9, ('blue')),
    (0, 0.8, ('green')),
    (0, 0.7, ('orange')),
    (0, 0.6, ('cyan')),
]

# Loop through the sensitivity data and create line series with added noise
for offset, amplitude, color in sensitivity_data:
    amplitudes = amplitude * (np.sin(np.radians(angles + offset)) + 0.3 * np.sin(np.radians(3 * angles))) * 45
    amplitudes += 5 * np.random.randn(len(angles))

    # Prepare the data for the line series
    data = [{'angle': angle, 'amplitude': amp} for angle, amp in zip(angles, amplitudes)]

    # Add line series to the chart
    line_series = chart.add_point_line_series().set_data(data)

    # Set the stroke properties for each line series
    line_series.set_stroke(thickness=2, color=color)

chart.open()