Legend
Legends describe chart components like series, highlighting their meaning and providing interactive controls. LightningChart Python supports both automatic chart legends and additional legends.
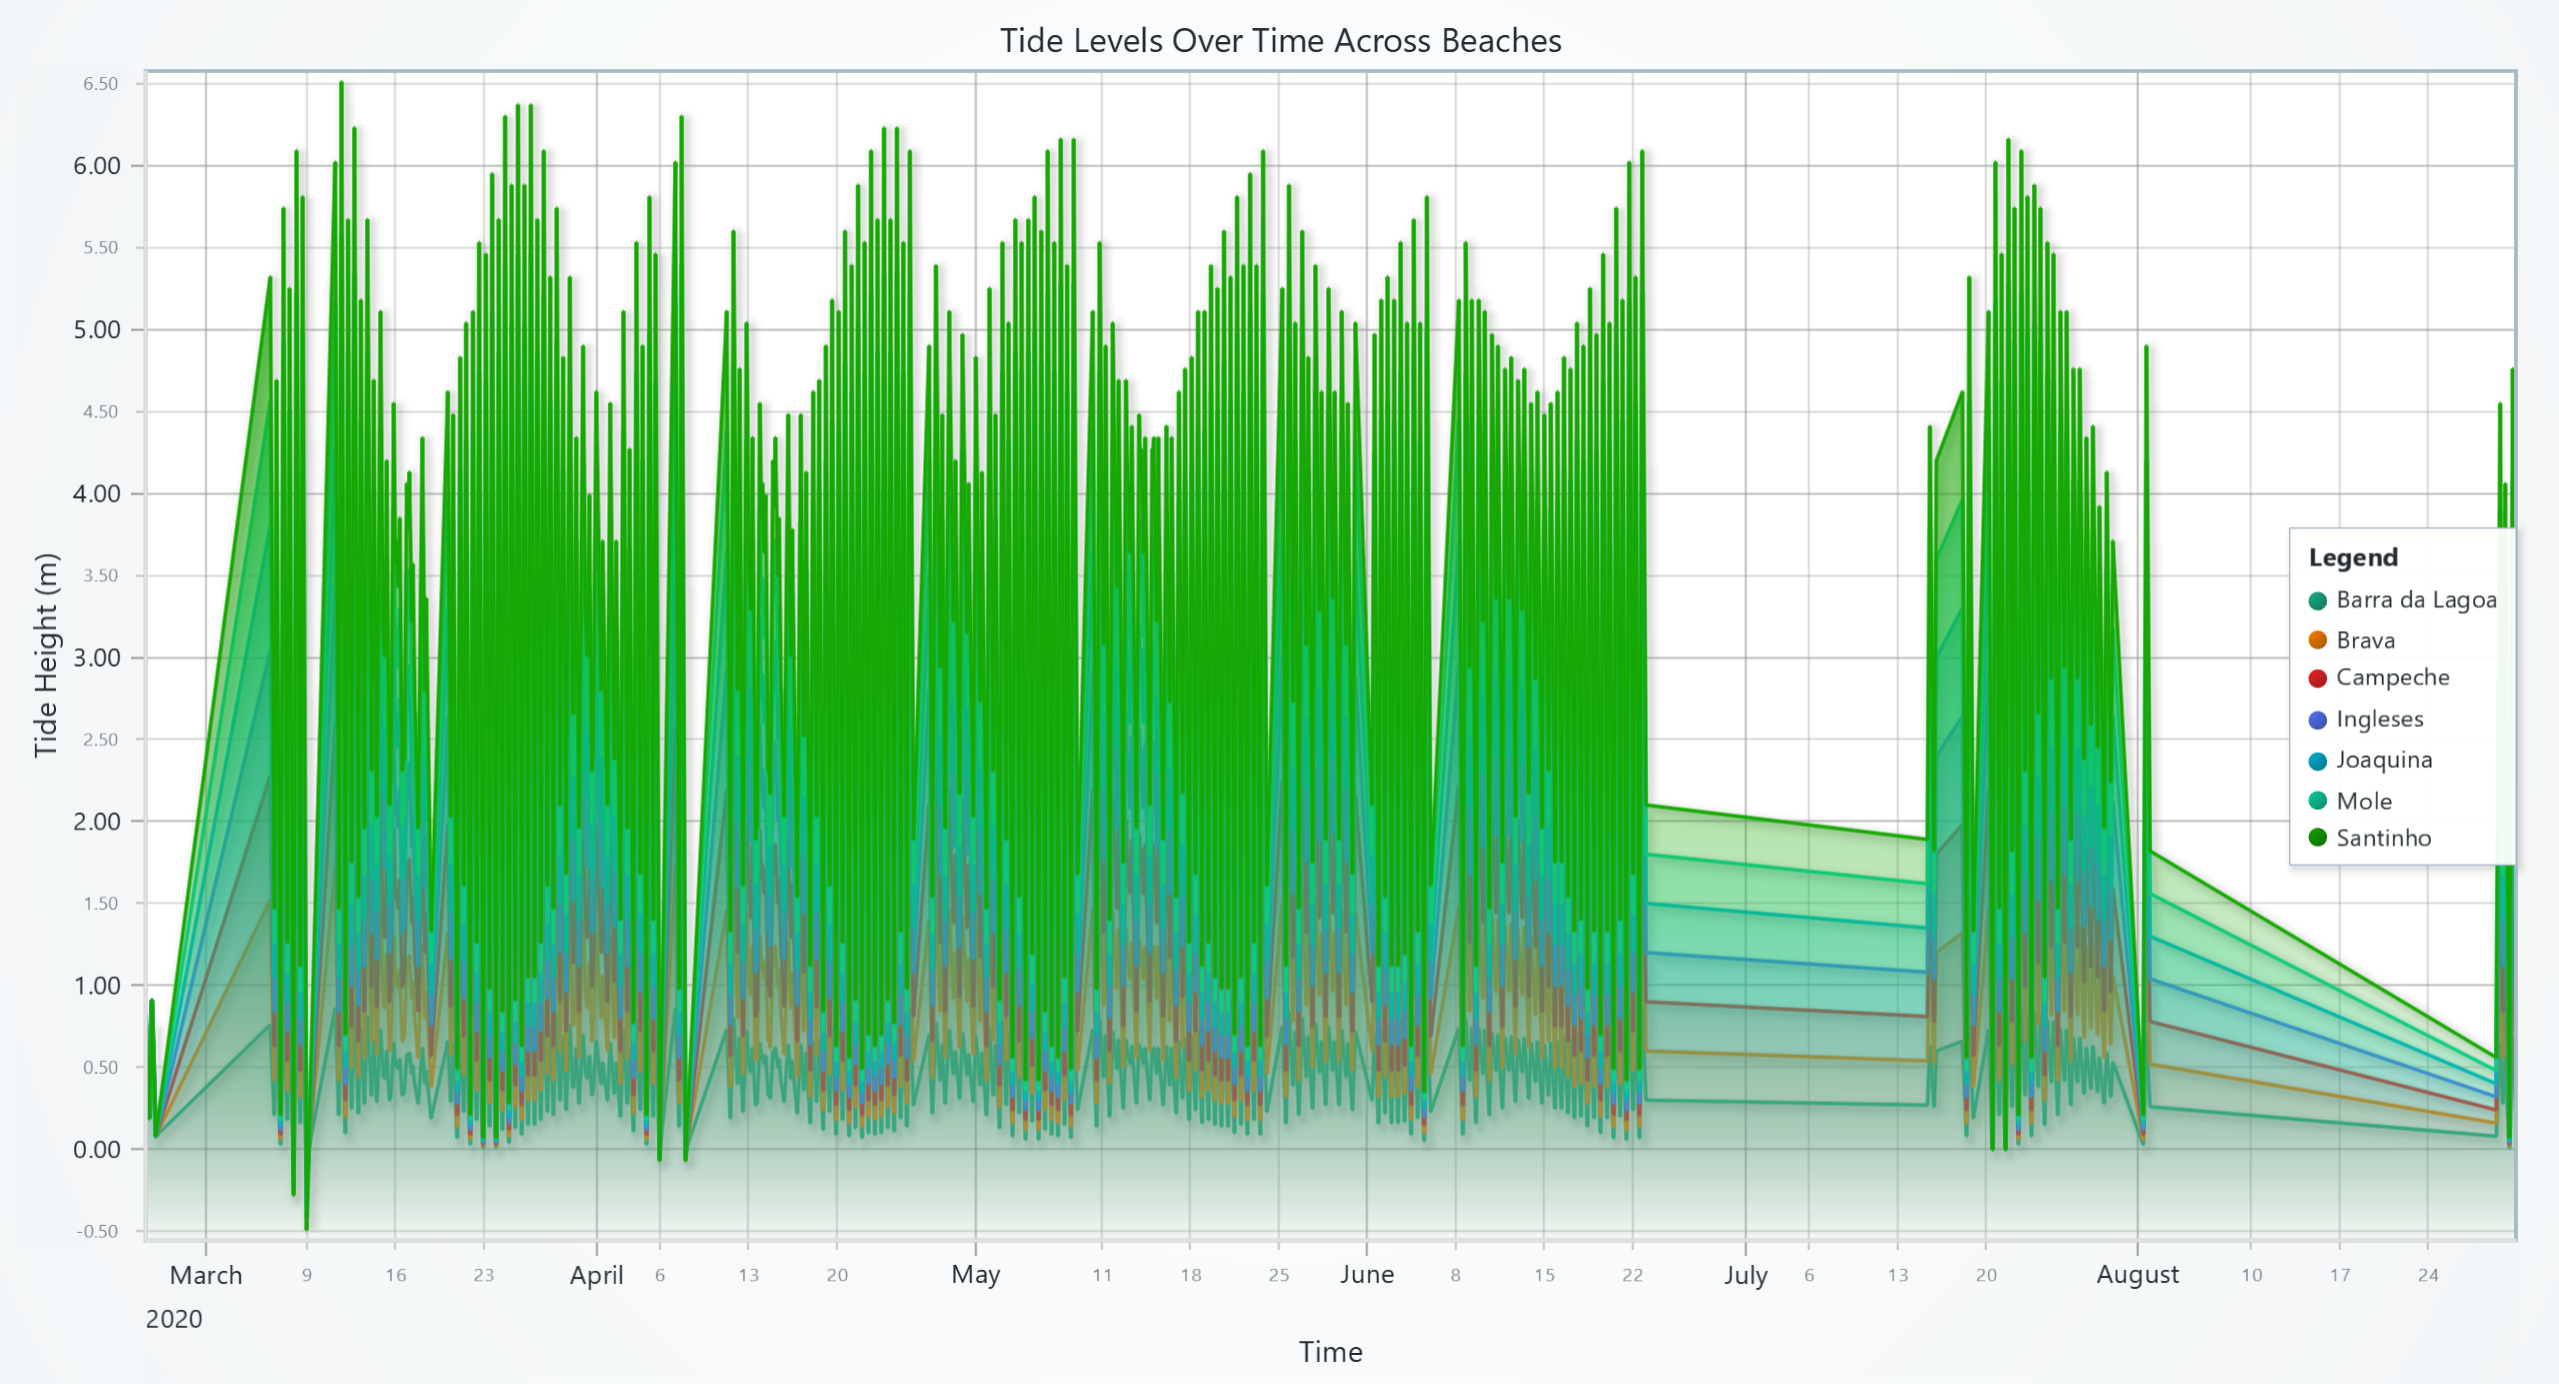
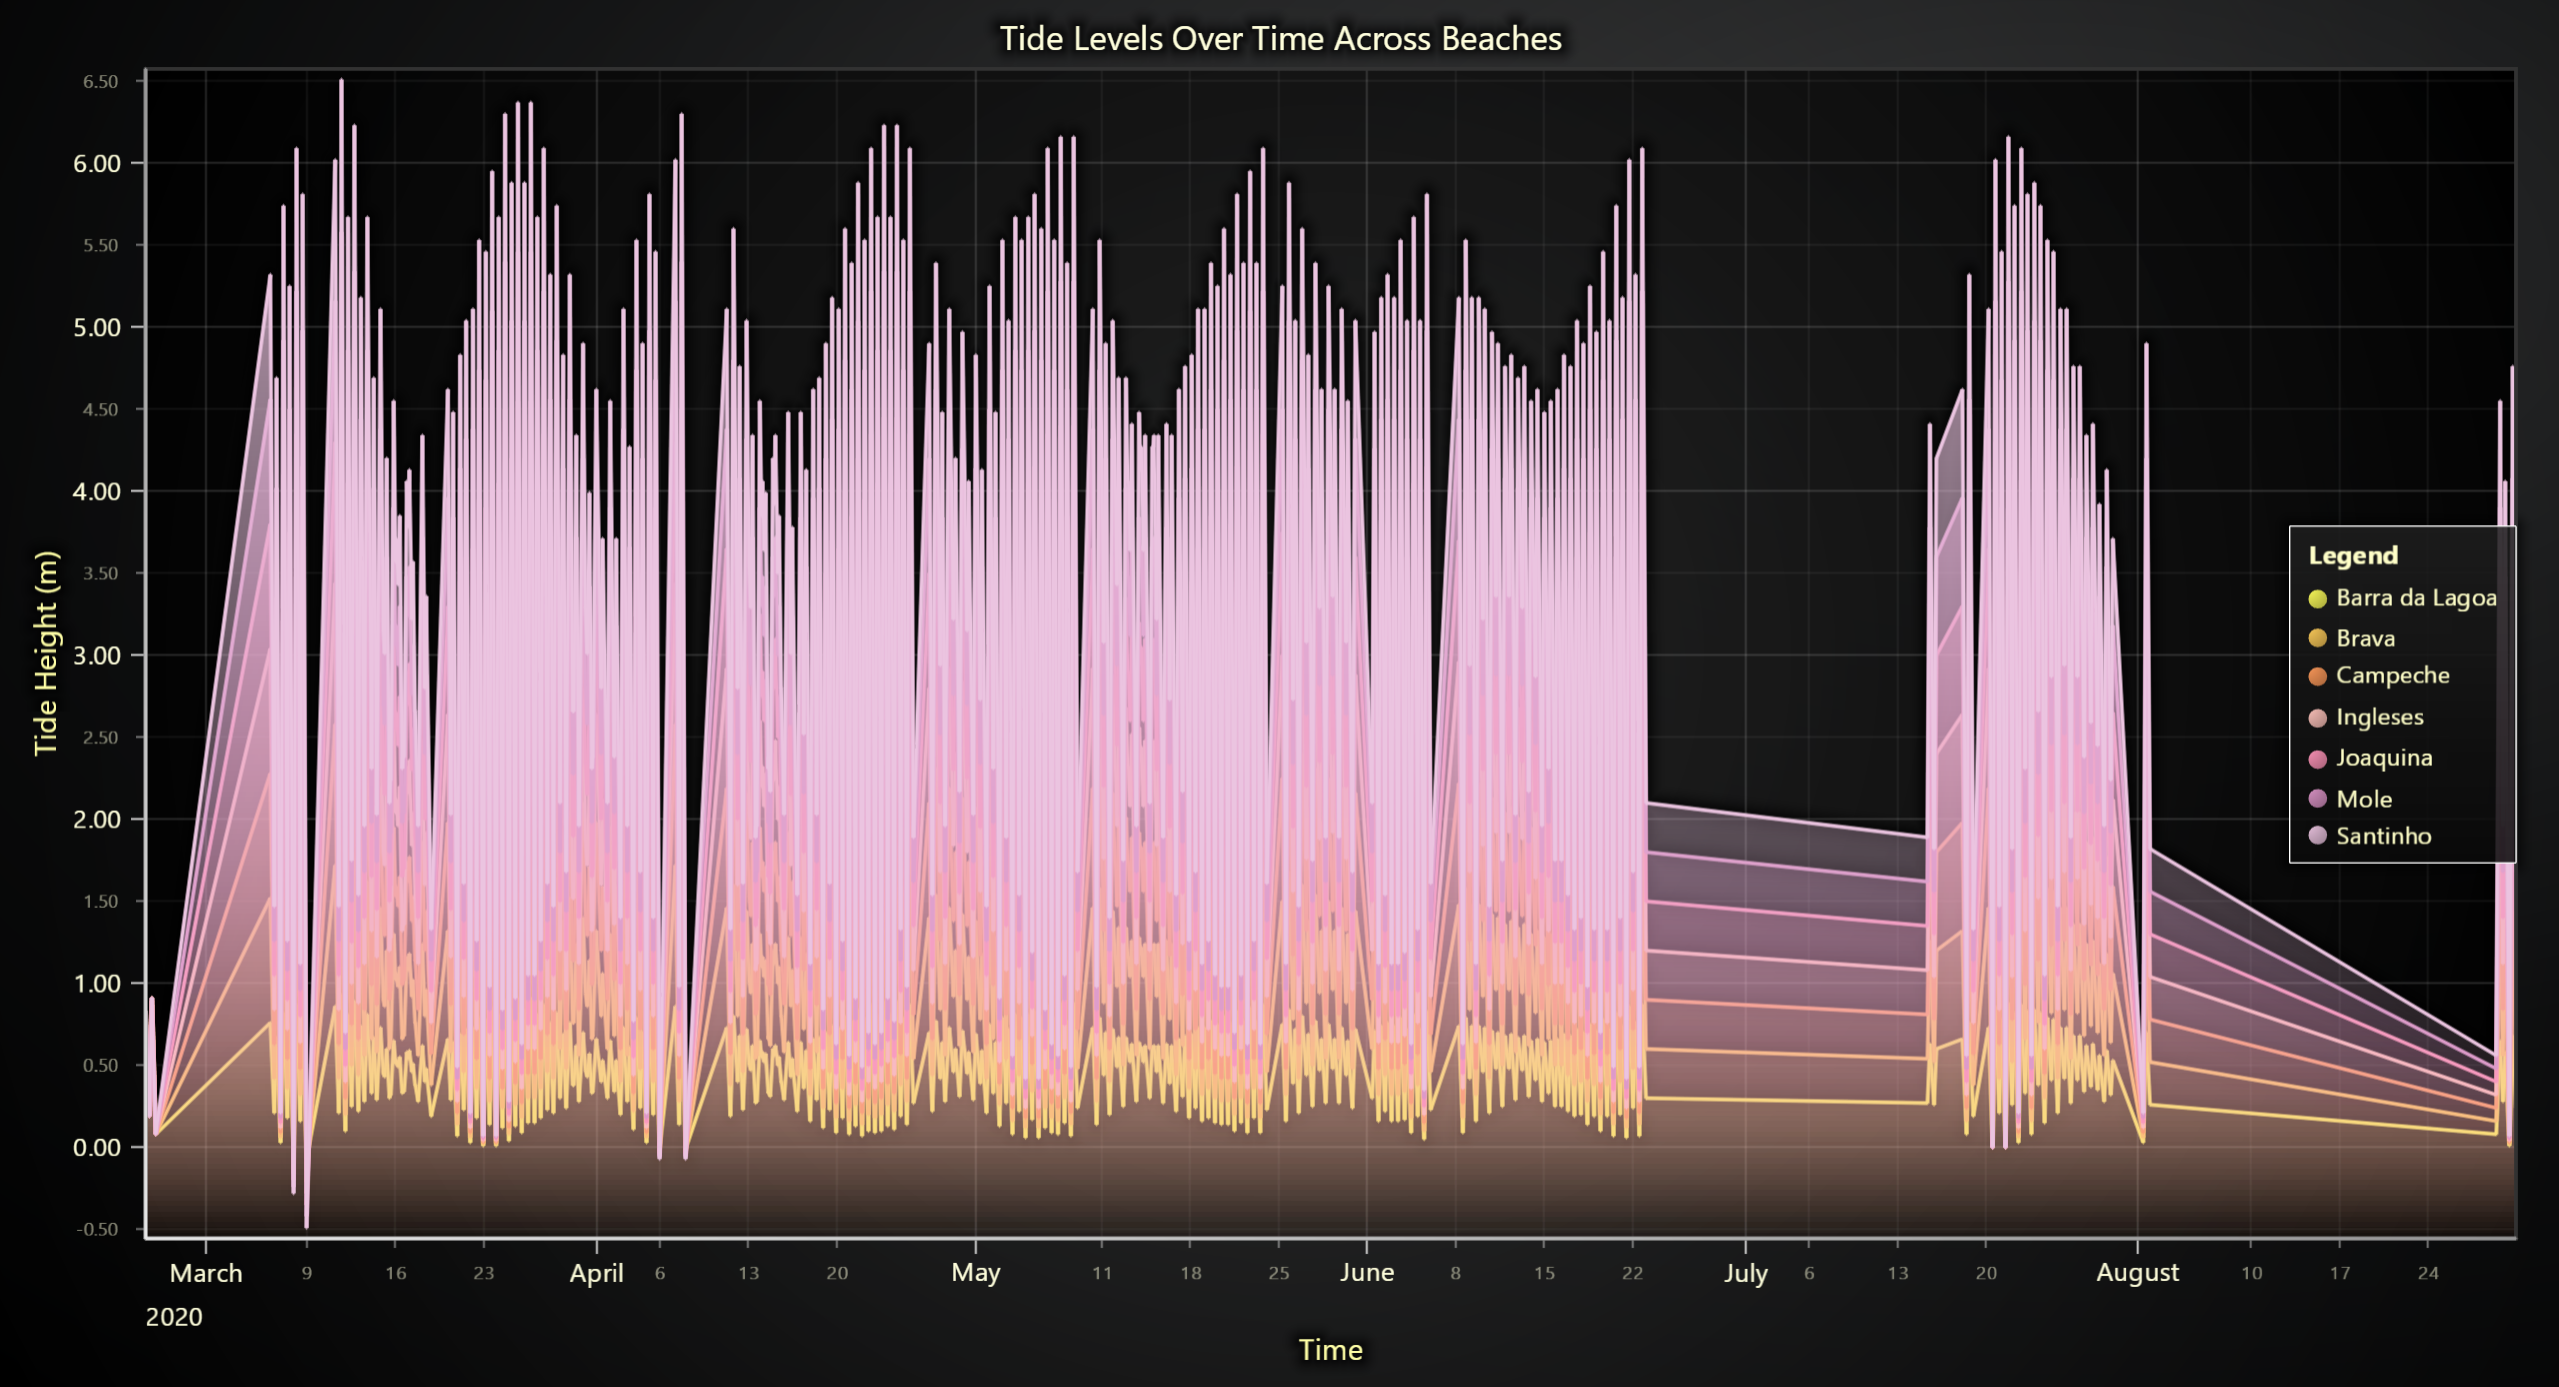
Legend Types
1. Default Chart Legend
Every chart comes with a built-in legend accessible via the legend property:
import lightningchart as lc

chart = lc.ChartXY(
    legend={
        'visible': True,
        'position': 'RightCenter',
        'title': 'Data Series'
    }
)

# Access the default legend
chart.legend.set_options(title="Updated Title")
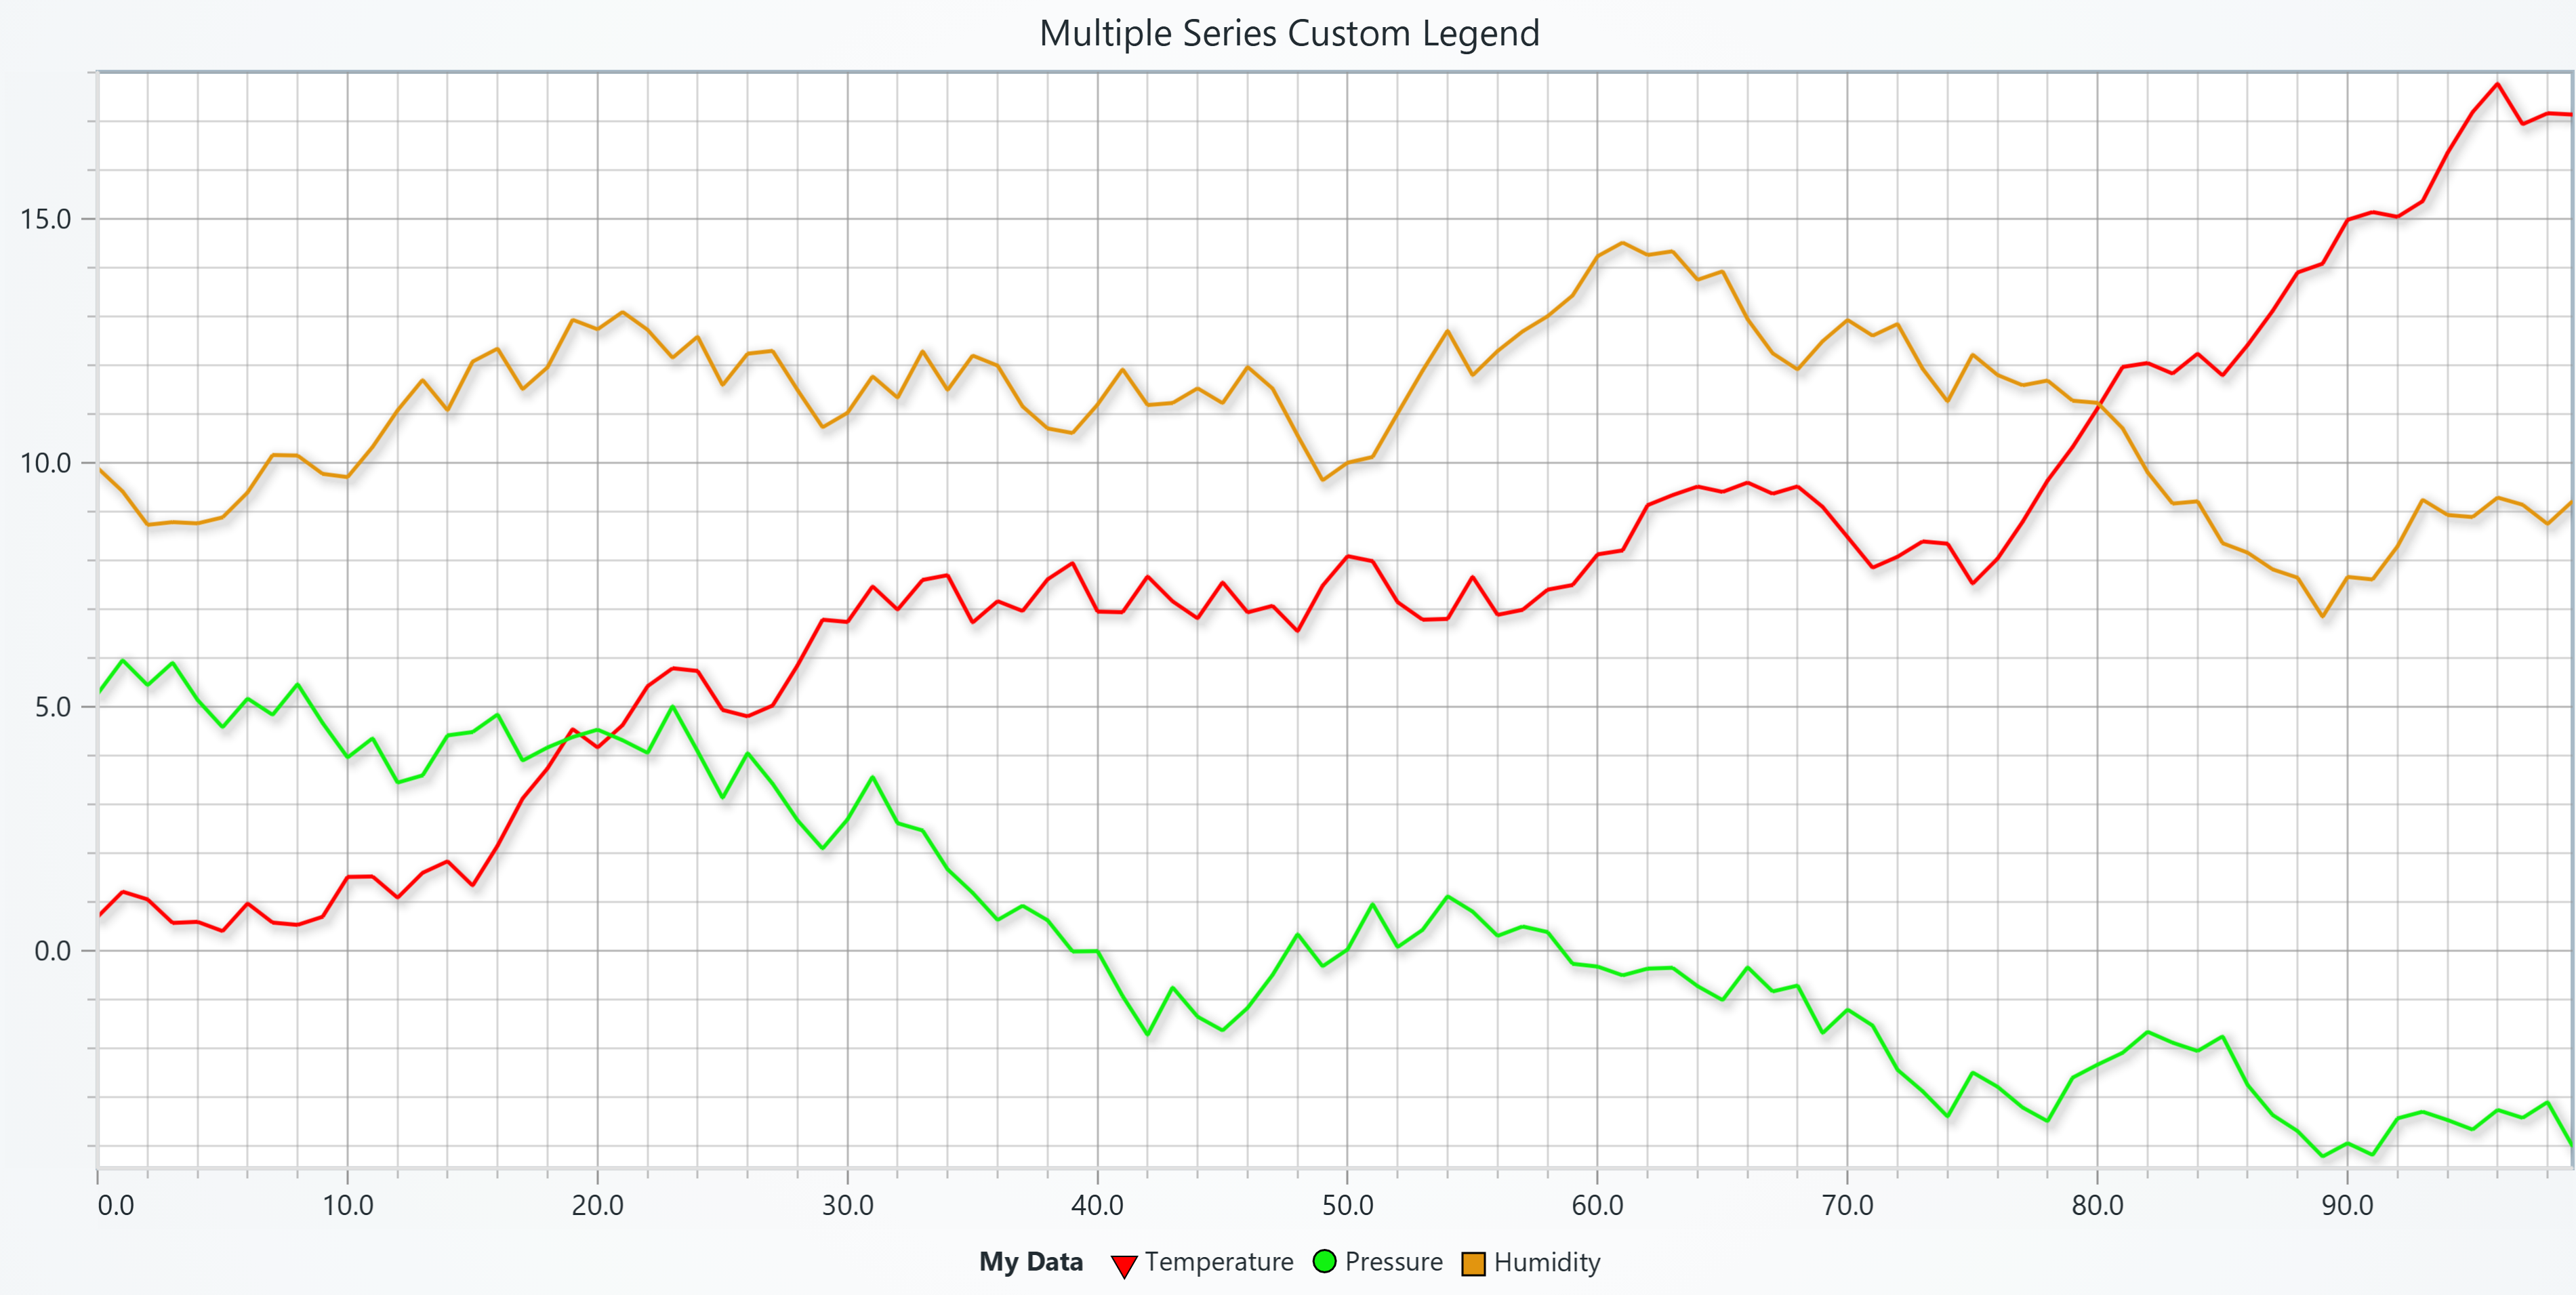
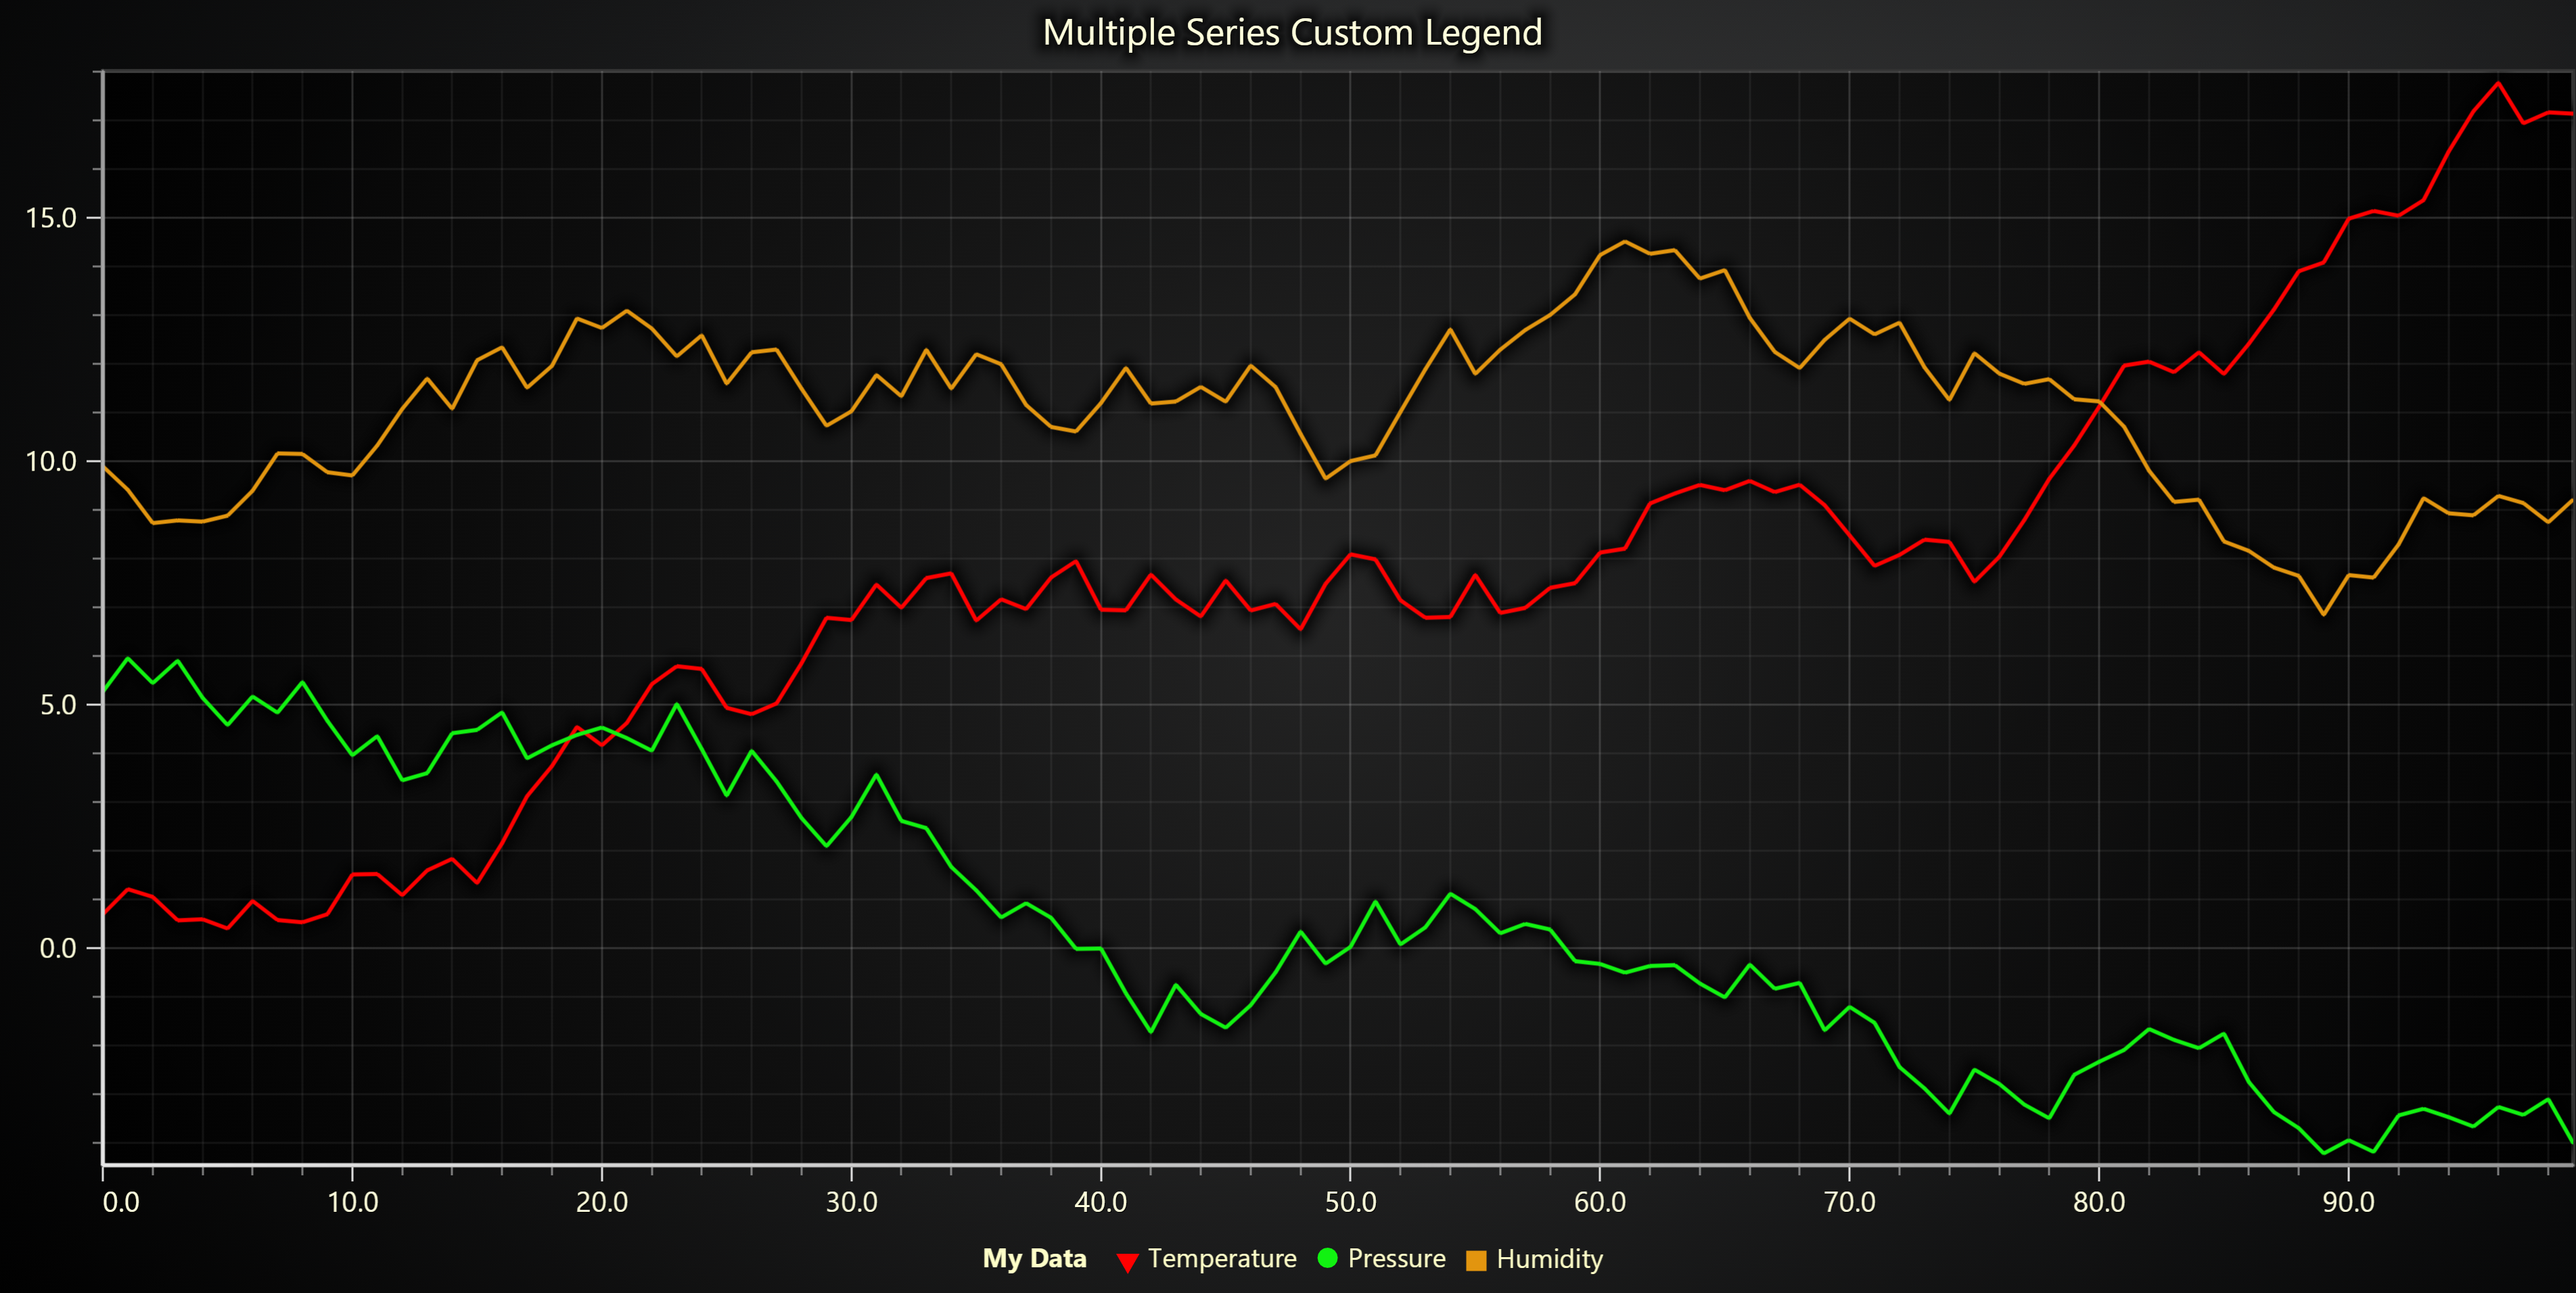
2. Additional legends
Add legends with full control over entries:
# Create a new legend
legend = chart.add_legend(
    title="Custom Legend",
    position='TopRight',
    add_entries_automatically=True
)

# Manually add additional legend
series = chart.add_line_series()
legend.add(component=series, options={'text': 'Series A', 'button_shape': 'Circle',})
Chart Legend Configuration
Configure the default chart legend during initialization:
chart = lc.ChartXY(
    legend={
    # Basic legend setup
        'visible': True,
        'position': 'RightCenter',
        'title': 'Data Series',

    # Layout and spacing
        'orientation': "Horizontal",
        'render_on_top':False,
        'padding':{'left': 5, 'top': 10, 'right': 5, 'bottom': 10},
        'margin_inner':10,
        'margin_outer':{'left': 50, 'top': 50, 'right': 50, 'bottom': 50},
        'entry_margin':8,

    # Background styling
        'background_visible':True,
        'background_fill_style':"#E08585",
        'background_stroke_style':{'thickness': 2, 'color': "#F054D3"},

    # Auto behavior
        'auto_hide_threshold':0.5,
        'add_entries_automatically':True,

    # Default entry styling
        'entries':{
            'button_shape': 'Triangle',
            'button_size': 20,
            'text_font': {'size': 20, 'weight': 'bold'},
        }
    }
)
Legend Positions
Use predefined position constants:
# Available positions
'RightTop'
'RightCenter'
'RightBottom'
'LeftTop'
'LeftCenter'
'LeftBottom'
'TopLeft'
'TopCenter'
'TopRight'
'BottomLeft'
'BottomCenter'
'BottomRight'

# Or use custom positioning
legend.set_options(position={'x': 100, 'y': 50, 'origin': 'LeftTop'})
Series Legend Configuration
Configure how individual series appear in legends:
# Hide series from legend
series = chart.add_line_series(
    legend={'show': False})

# Add legend entry
series = chart.add_line_series(
    legend=
    {
        'button_shape': 'Triangle',
        'button_size': 20,
        'button_fill_style': '#00FF00',
        'button_stroke_style': {'thickness': 5, 'color': '#000000'},
        'button_rotation': 45,
        'text': 'Series A',
        'text_font': {'size': 20, 'weight': 'bold'},
        'text_fill_style': '#0000FF',
        'match_style_exactly': True,
    }
)

# Available button shapes
# 'Circle', 'Square', 'Triangle', 'Diamond', 'Plus', 'Cross', 'Minus', 'Star', 'Arrow'
Legend Entry Management
Adding Entries to Default Chart Legend
Use chart.add_legend() to add standalone entries to the default chart legend, when using legends with chart.add_legend(), disable automatic entry addition to prevent conflicts:
chart = lc.ChartXY(
    legend={
        'visible': True,
        'add_entries_automatically':False ,  # Prevents conflicts with standalone legends
    }
)

series = chart.add_line_series(
    legend=
    {
        'button_shape': 'Triangle',
        'button_size': 20,
        'button_fill_style': '#00FF00',
        'text': 'Series A',
        'text_font': {'size': 20, 'weight': 'bold'},
        'text_fill_style': '#0000FF',
    }
)

# Add additional standalone entry
legend = chart.add_legend(title='My Legend', position='TopRight')
legend.add(series, {}) #  To add a series to the legend

# or attach all series in the chart
legend.add(chart, {})
Removing Legend
# Remove a series entry from a user-created legend
legend.remove(series)            # removes that entry from `legend`

# Remove a series entry from the default legend
chart.legend.remove(series)

# Clear all entries from the default legend
chart.legend.clear()

# Remove (dispose) the entire user-created legend widget
legend.dispose()
Configuring Legend Options
# Update legend appearance
chart.legend.set_options(
    visible=True,
    title="Updated Legend",
    position='TopLeft',
    orientation='Horizontal',
    background_visible=True,
    background_fill_style="#f5f5f5",
    background_stroke_style={'thickness': 1, 'color': '#ccccccff'},
    padding=12,
    margin_inner=8,
    entry_margin=6
)
Configuring Individual Entries
The set_entry_options() method works with various chart components (series, LUTs, etc.):
# Customize how a series appears in legend
chart.legend.set_entry_options(
    series,
    text="Primary Dataset",
    button_shape='Square',
    button_size=18,
    button_fill_style='#0066cc',
    text_font={'size': 14, 'weight': 'bold'},
    show=True
)

# Customize how a LUT appears in legend
LUT = chart.set_lut(axis_key="temperature", interpolate=True, steps=[...])
chart.legend.set_entry_options(
    LUT,
    text="Temperature Scale",
    button_shape='Triangle',
    button_size=20,
    text_font={'size': 22, 'weight': 'bold'},
    lut_length=180,
    lut_thickness=35
)
Legend Orientations
# Available Orientations
'Horizontal'
'Vertical'
Band and Constant Line Legend Configuration
Configure legend entries for chart annotations like bands and constant lines.
Band with Legend
band = axis.add_band(
    legend=
    {
        'show': True,
        'button_shape': 'Triangle',
        'button_size': 20,
        'button_fill_style': '#00FF00',
        'button_stroke_style': {'thickness': 5, 'color': '#000000'},
        'button_rotation': 45,
        'text': 'Series A',
        'text_font': {'size': 20, 'weight': 'bold'},
        'text_fill_style': '#0000FF',
        'match_style_exactly': True,
        'highlight': True,
    }
    )
Constant Line with Legend
constant_line = axis.add_constant_line(
    legend=
    {
        'show': True,
        'button_shape': 'Triangle',
        'button_size': 20,
        'button_fill_style': '#00FF00',
        'button_stroke_style': {'thickness': 5, 'color': '#000000'},
        'button_rotation': 45,
        'text': 'Series A',
        'text_font': {'size': 20, 'weight': 'bold'},
        'text_fill_style': '#0000FF',
        'match_style_exactly': True,
        'highlight': True,
    }
)
Heatmap Legend Features
For series with color mappings (like heatmaps), legends support Look-Up Tables (LUTs):
series = chart.add_heatmap_series(
    legend=
    {
        'lut_length': 200,
        'lut_thickness': 10,
        'lut_display_proportional_steps': True,

    }
)
Gauge Chart
Here you can see how legend could be added to gauge charts:
chart = lc.GaugeChart(title='Gauge Chart')

# Add additional legend entry
legend = chart.add_legend(title='Legend 2', position='TopRight')
legend.add(None,
    {
        'show': True,
        'button_shape': 'Triangle',
        'button_size': 20,
        'button_fill_style': '#CB5B15',
        'button_stroke_style': {'thickness': 5, 'color': '#003300'},
        'button_rotation': 45,
        'text': 'Temperature Sensor',
        'text_font': {'size': 20, 'style': 'italic'},
        'text_fill_style': '#0000FF',
        'match_style_exactly': True,
        'lut_length': 180,
        'lut_thickness': 15,
        'lut_display_proportional_steps': True,
    }
)

chart.set_interval(start=0, end=100)
chart.set_value(64.78)
Legend with Auto-Hide
chart = lc.ChartXY(
    legend={
        'auto_hide_threshold': 0.25,  # Hide when legend takes >25% of chart area
        'add_entries_automatically':True  # Auto-add new series
    }
)
Legend Panels
Legend Panels are dedicated dashboard cells for displaying multiple legend entries from different charts in a unified panel.
Legend Panel in Dashboard
import lightningchart as lc

# Create dashboard
db = lc.Dashboard(rows=2, columns=2)

# Create charts
chart1 = db.ChartXY(column_index=0, row_index=0)
chart2 = db.ChartXY(column_index=1, row_index=0)

series1 = chart1.add_line_series()
series2 = chart2.add_point_series()

# Create legend panel
legend_panel = db.LegendPanel(
    column_index=0,
    row_index=1,
    column_span=2,
    row_span=1,
    legend={
        'title': 'Combined Legend',
        'orientation': 'Horizontal'
    }
)

# Add components from different charts
legend_panel.add(chart1)
legend_panel.add(chart2)

db.open()
Legend Panel in Container
import lightningchart as lc

# Create container
sc_db = lc.Container(columns=2, rows=2)

# Create charts
chart1 = sc_db.ChartXY(column_index=0, row_index=0)
chart2 = sc_db.ChartXY(column_index=1, row_index=0)

series1 = chart1.add_line_series()
series2 = chart2.add_area_series()

# Create legend panel
legend_panel = sc_db.LegendPanel(
    column_index=0,
    row_index=1,
    column_span=2,
    row_span=1,
    legend={
        'title': 'Shared Legend',
        'background_visible': True,
        'background_fill_style': '#f5f5f5ff'
    }
)

# Add components
legend_panel.add(chart1)
legend_panel.add(chart2)

sc_db.open()
Legend Panel Methods
# Set background styling
legend_panel.set_background_color('red')
legend_panel.set_background_stroke(thickness=1, color='#cccccc')

# Set minimum size (affects dashboard splitter)
legend_panel.set_minimum_size(width=200, height=100)

# Add text box
textbox = legend_panel.add_textbox(
    text='Legend Description',
    x=50,
    y=10,
    position_scale='percentage'
)

# Remove panel
legend_panel.dispose()