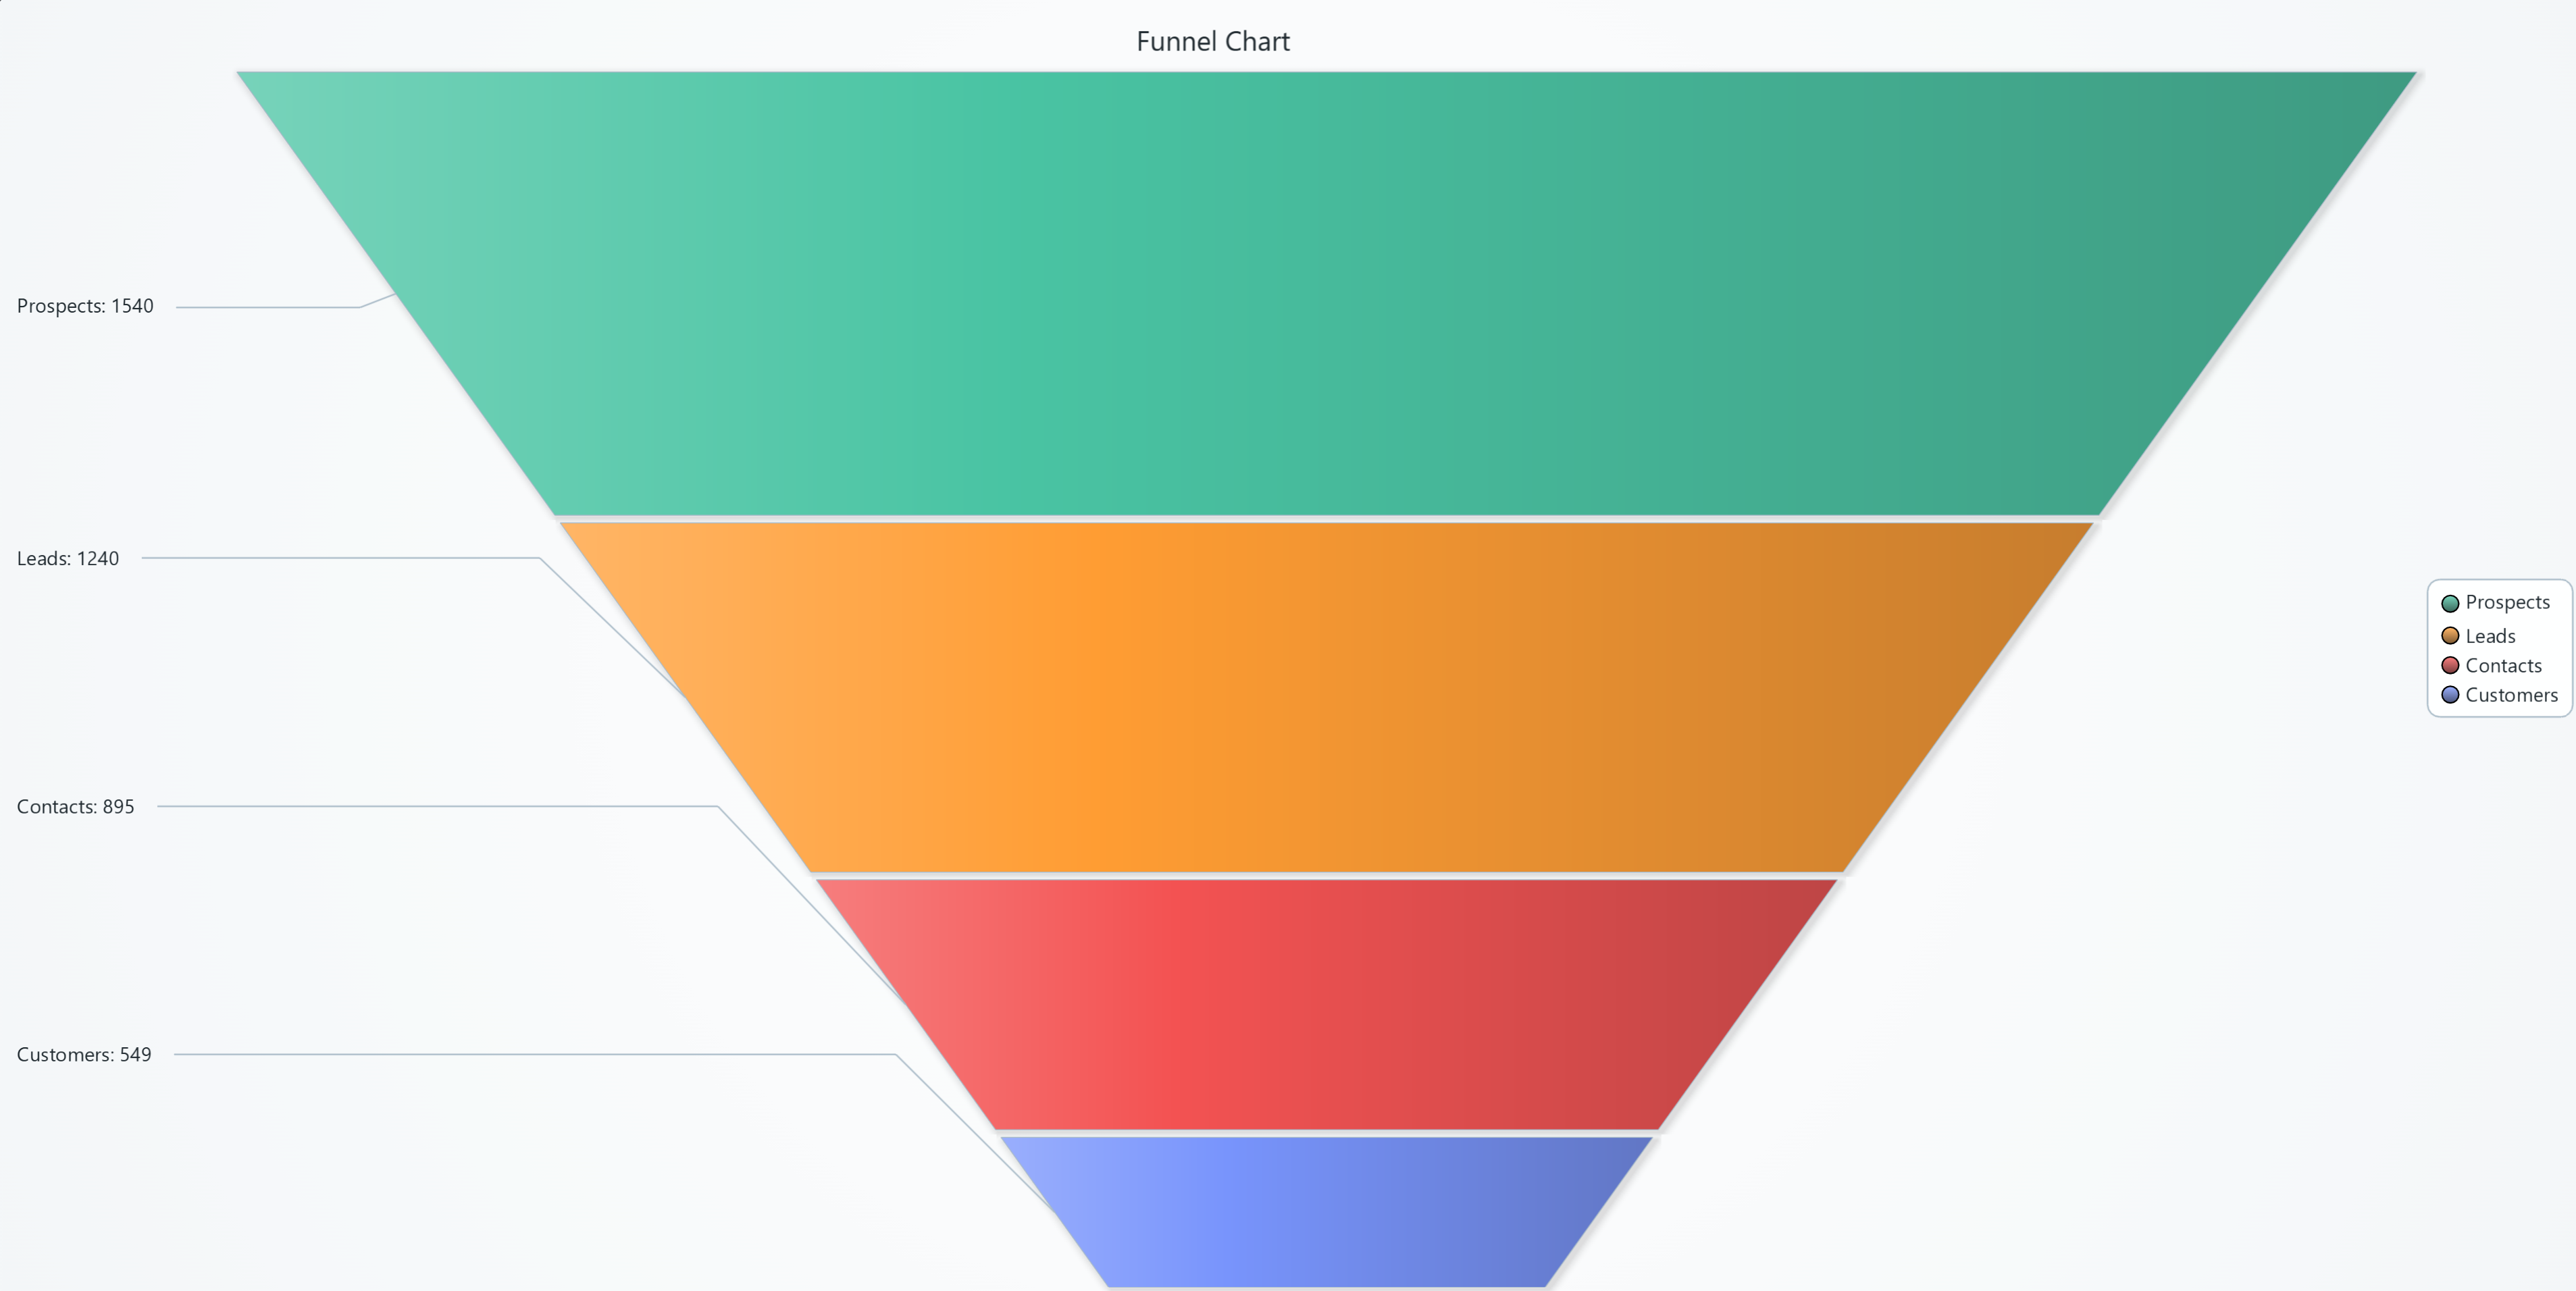
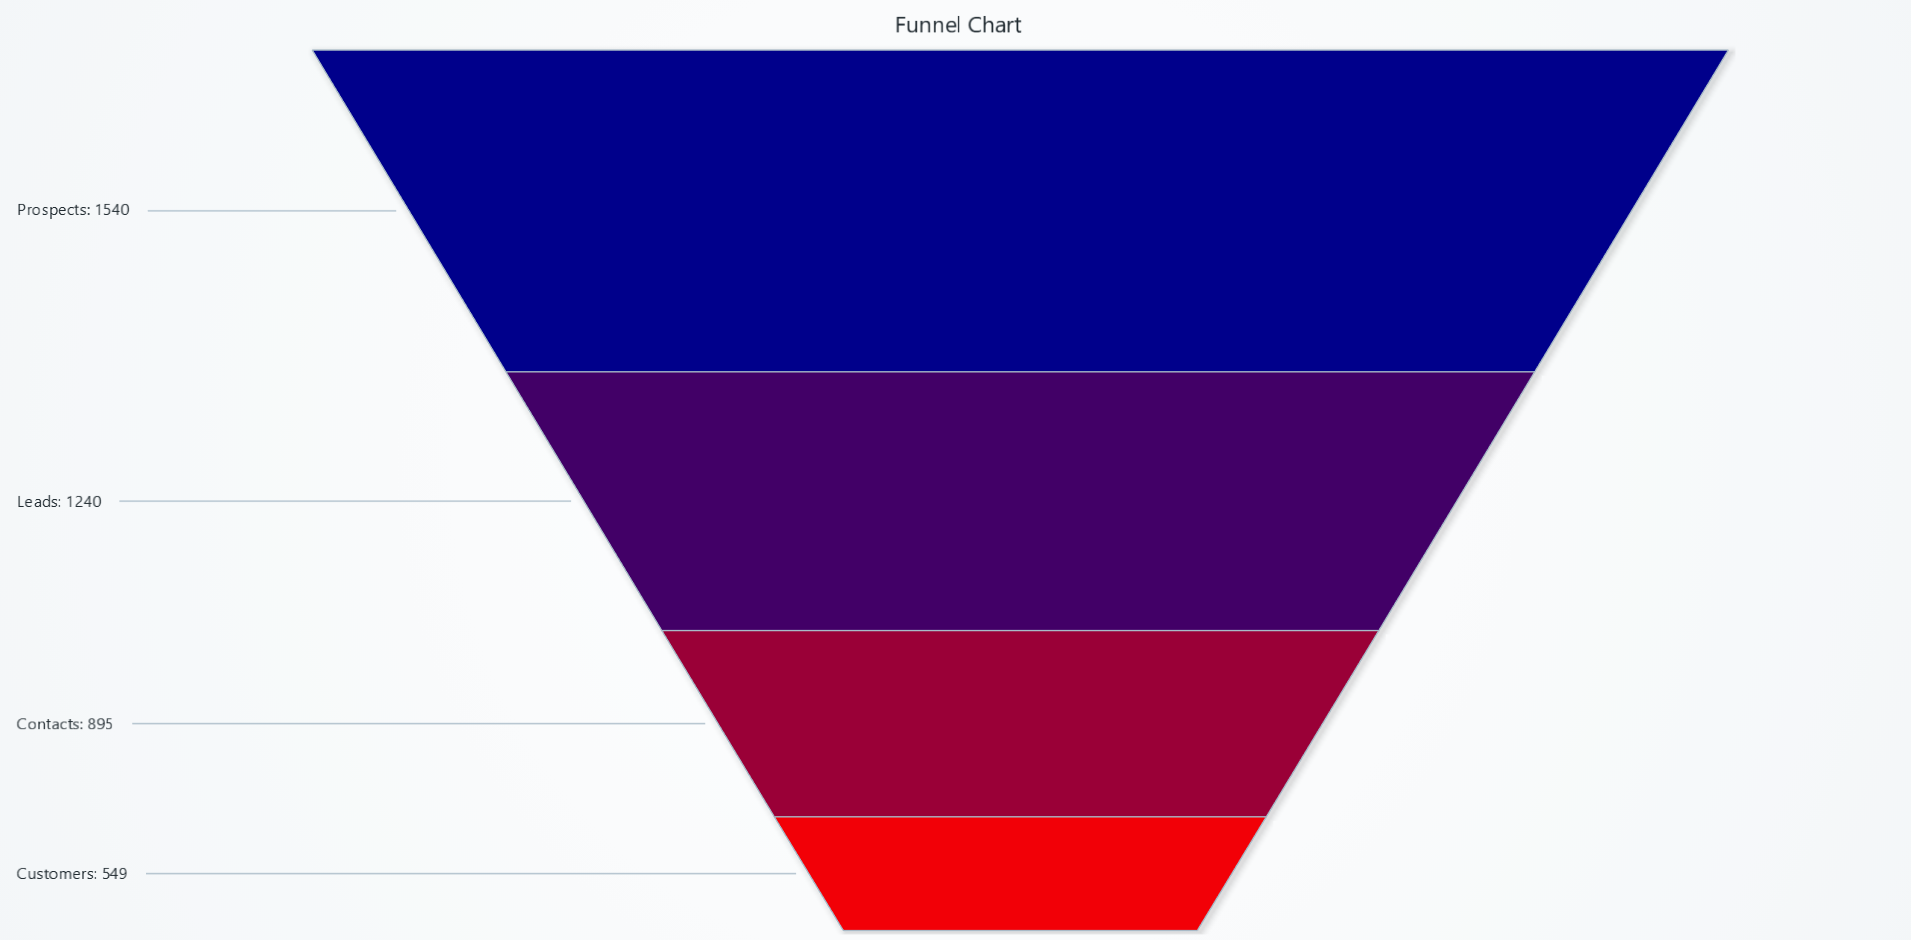
Funnel Chart
Visualizes proportions and percentages between categories, by dividing a funnel into proportional segments.
Creating Funnel Chart
import lightningchart as lc

chart = lc.FunnelChart(slice_mode='height', theme=lc.Themes.Light, title='Funnel Chart')
Appearance Customization
Customize the look and layout of your Chart using the following methods.
Title
chart.set_title_color('#3498db')
chart.set_title_font(size=20, weight='bold')
chart.set_title_margin(10)
chart.set_title_rotation(0)
chart.set_title_effect(True)
Padding
Adjusts the space around the chart's plot area.
chart.set_padding(10)  # Uniform padding
chart.set_padding(left=10, top=15)  # Specific sides
chart.set_padding(left=10, top=15, right=20, bottom=25)  # All sides
Background Color
Sets the background fill color of the chart.
chart.set_background_color("#ffffff")
Background Stroke
Defines the border (stroke) around the chart's background.
chart.set_background_stroke(2, "#cccccc")
Funnel Chart Types
There are two different Funnel chart types available. The available APIs differ slightly between them.
Labels on sides (default)
chart = lc.FunnelChart(labels_inside=False)
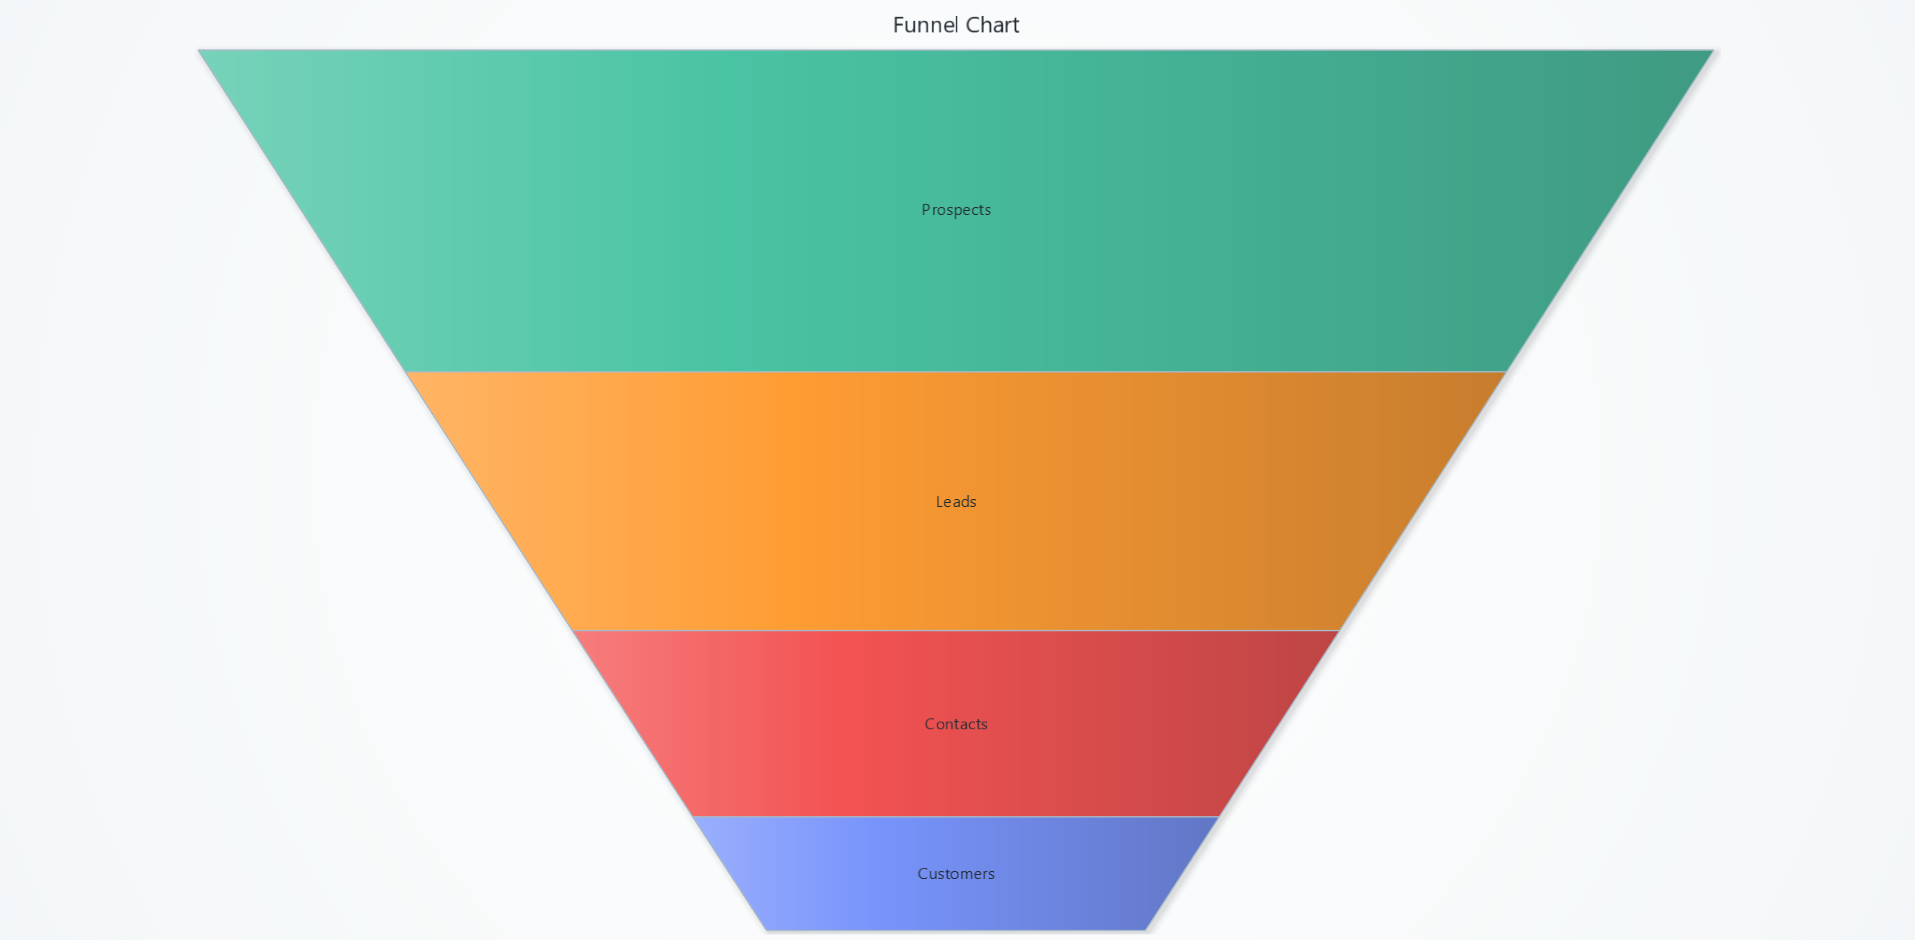
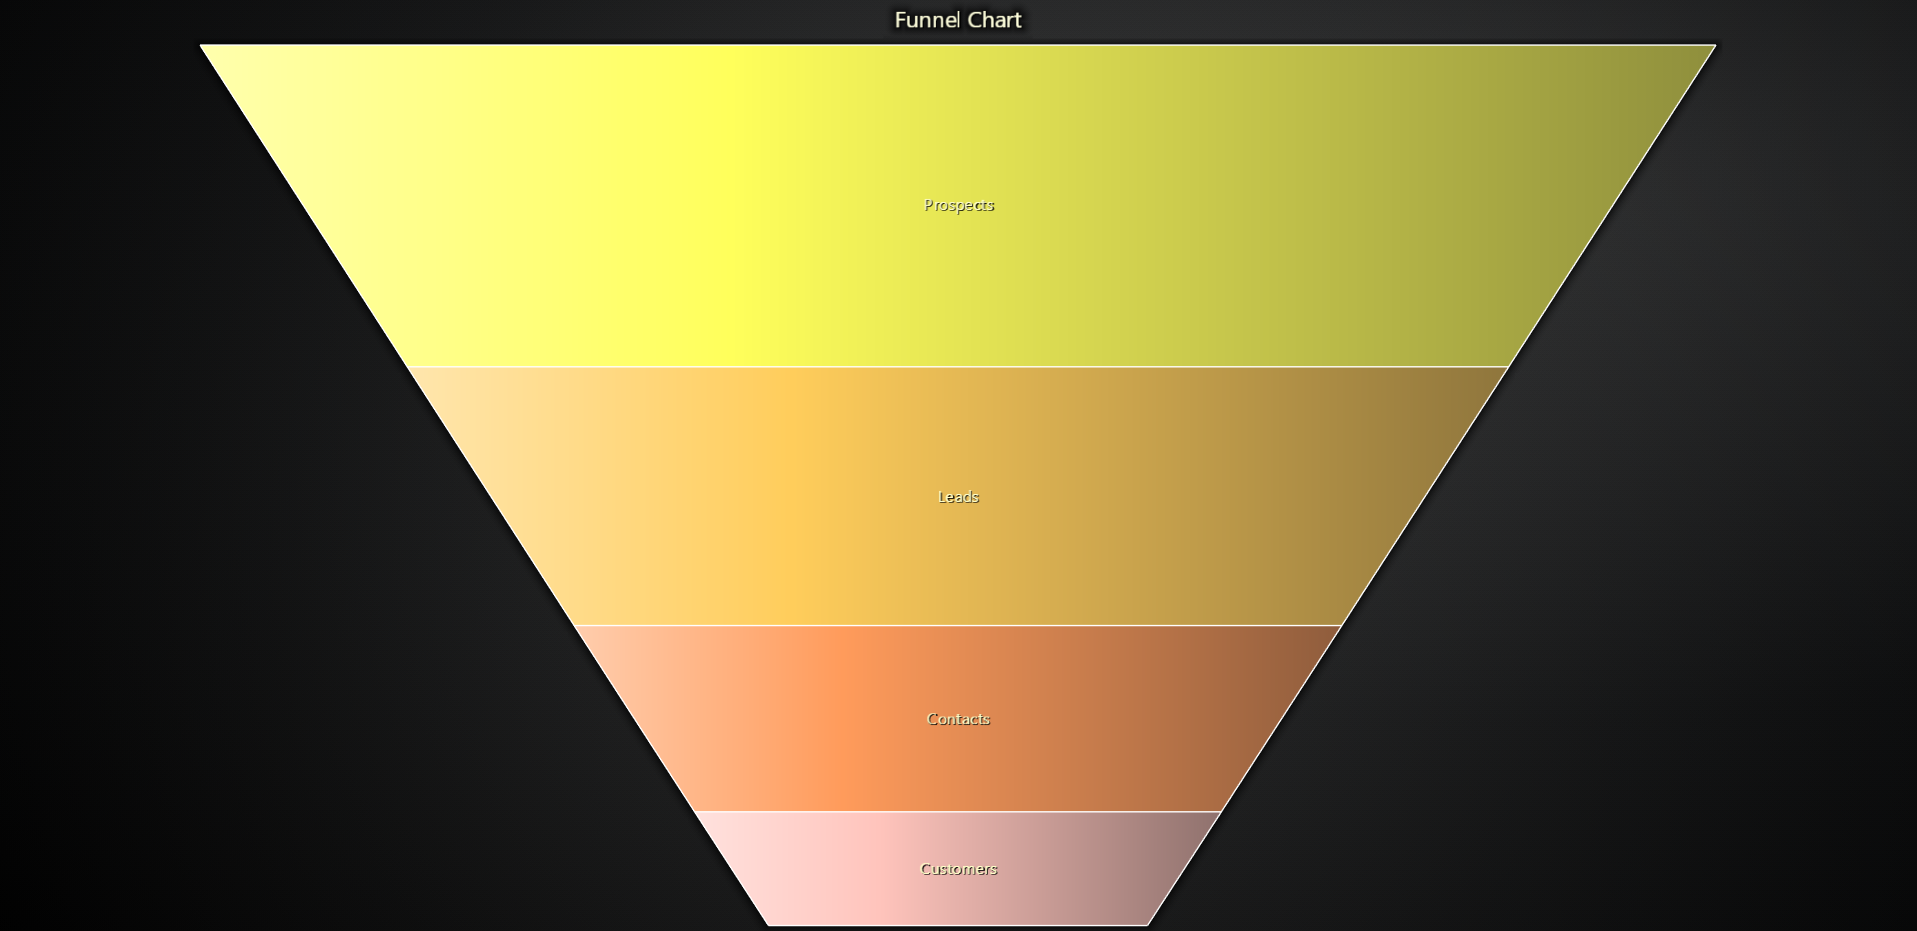
Labels inside slices
chart = lc.FunnelChart(labels_inside=True)
Label Formatting & Styling
Control what appears in each slice's label and how it looks.
# Choose what the label shows: only name, name + value, or name + percentage
chart.set_label_formatter("NamePlusRelativeValue")

# Change the text color of every slice label
chart.set_label_color('#333333')

# Adjust label font size, family, weight, and style
chart.set_label_font(
    size=14,
    family="Arial, sans-serif",
    style="italic",
    weight="bold"
)

# Enable or disable the theme's built-in label glow/drop-shadow
chart.set_label_effect(True)


# Display all labels on the right side of the funnel
chart.set_label_side("right")
Slice Effects & Colors
Add extra visual flair to the slices themselves and control their fill colors.
# Turn on the theme's slice effect
chart.set_slice_effect(True)
# Apply a specific list of colors—one per slice, in order
chart.set_slice_colors([
'#E15759',
'#59A14F',
'#4E79A7',
'#F28E2B'
])
# Sort slices by name, ascending value, descending value, or leave as-is
chart.set_slice_sorter("valueDescending")
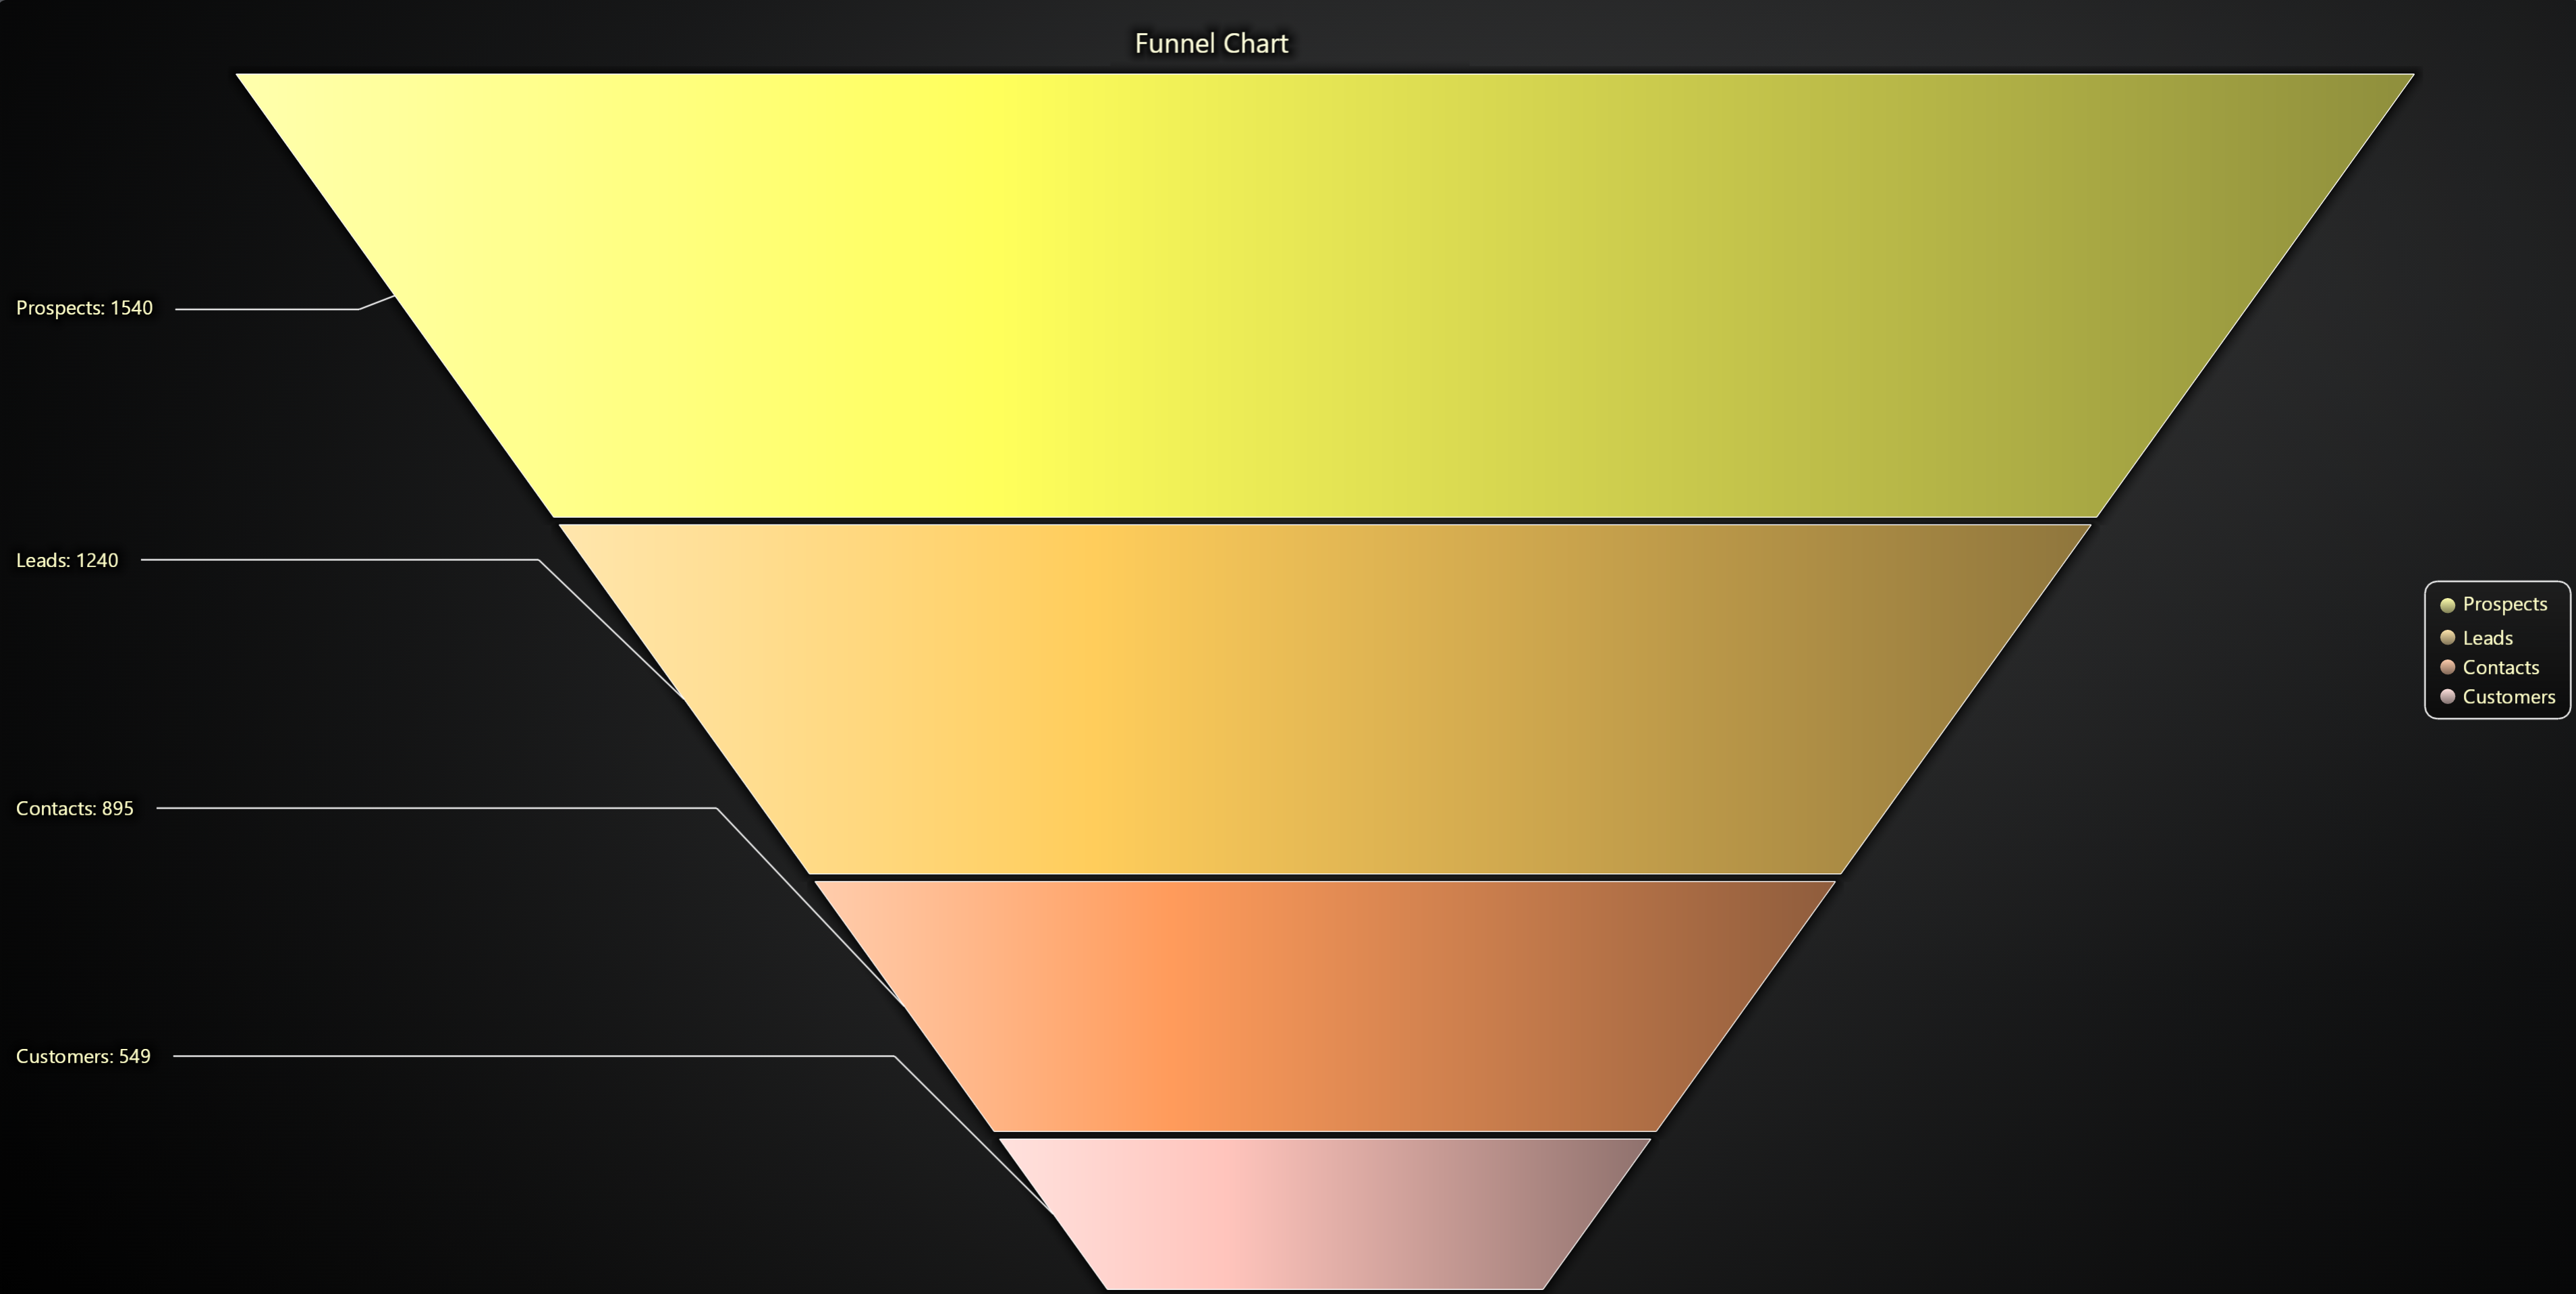
# Attach lookup table (LUT) to fill the slices with colors based on value
chart.set_lookup_table(
steps=[
{'value': 0, 'color': '#ADD8E6'},
{'value': 500, 'color': '#FF0000'},
{'value': 1500, 'color': '#00008B'},
],
interpolate=True,
percentage_values=False,
)

Funnel Shape & Proportions
Adjust the overall taper of the funnel's top “head” and bottom “neck.”
# Set the width of the top (head) as a percentage of full width (0–100)
chart.set_head_width(80)

# Set the width of the bottom (neck) as a percentage of full width (0–100)
chart.set_neck_width(30)
Connector Adjustments
Fine-tune the lines that link labels to slices.
# Gap between slice edge → connector start → connector end → label
chart.set_label_connector_gap_before_slice(4)
chart.set_label_connector_length_after_slice(4)
chart.set_label_connector_style(
    style="dashed",
    thickness=1,
    color='#666666'
)

# Add 4px of space between each slice
chart.set_slice_gap(4)
Adding & Styling Slices
Dynamic control over slice data and “explosion” behavior.
# Add slices one-by-one or in bulk
chart.add_slice("Q1", 25)
chart.add_slices([
    {"name": "Q2", "value": 30},
    {"name": "Q3", "value": 20},
    {"name": "Q4", "value": 25}
])

# Outline each slice with a thin dark border
chart.set_slice_stroke(1, '#222222')
Slice Orientation Mode
Choose whether each segment's size is determined by its height (vertical slice) or width (horizontal slice).
# Use slice height to reflect values (vertical funnel)
chart.set_slice_mode("height")

# Or use slice width (horizontal funnel appearance)
chart.set_slice_mode("width")
Disable/Enable animations
# To disable or enable all animations of the Chart
chart.set_animations_enabled(True)
Coordinate Transformation
Please refer to Coordinate Transformation section.
Add TextBox
Please see common TextBox section.
Cursors
Please see common Cursors section.
Legend
Please see common legend section.