TreeMap Chart
Chart type that visualizes hierarchical data using nested rectangles.
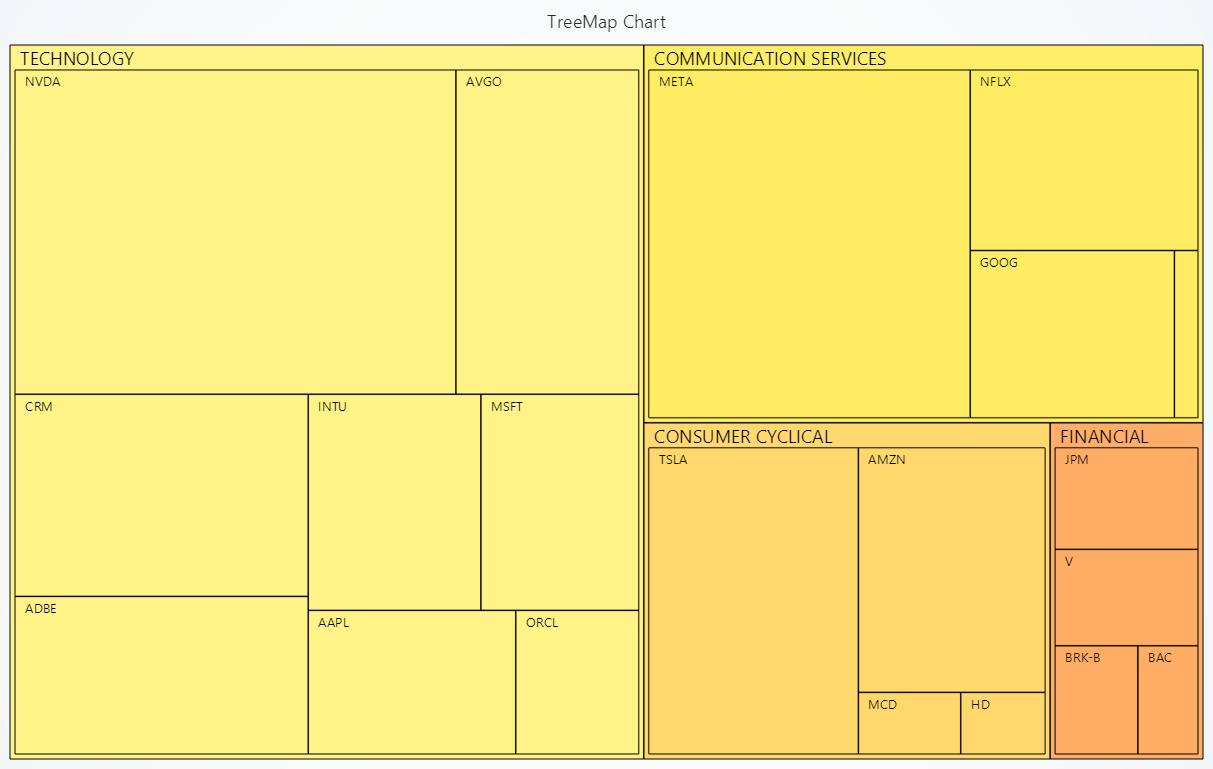
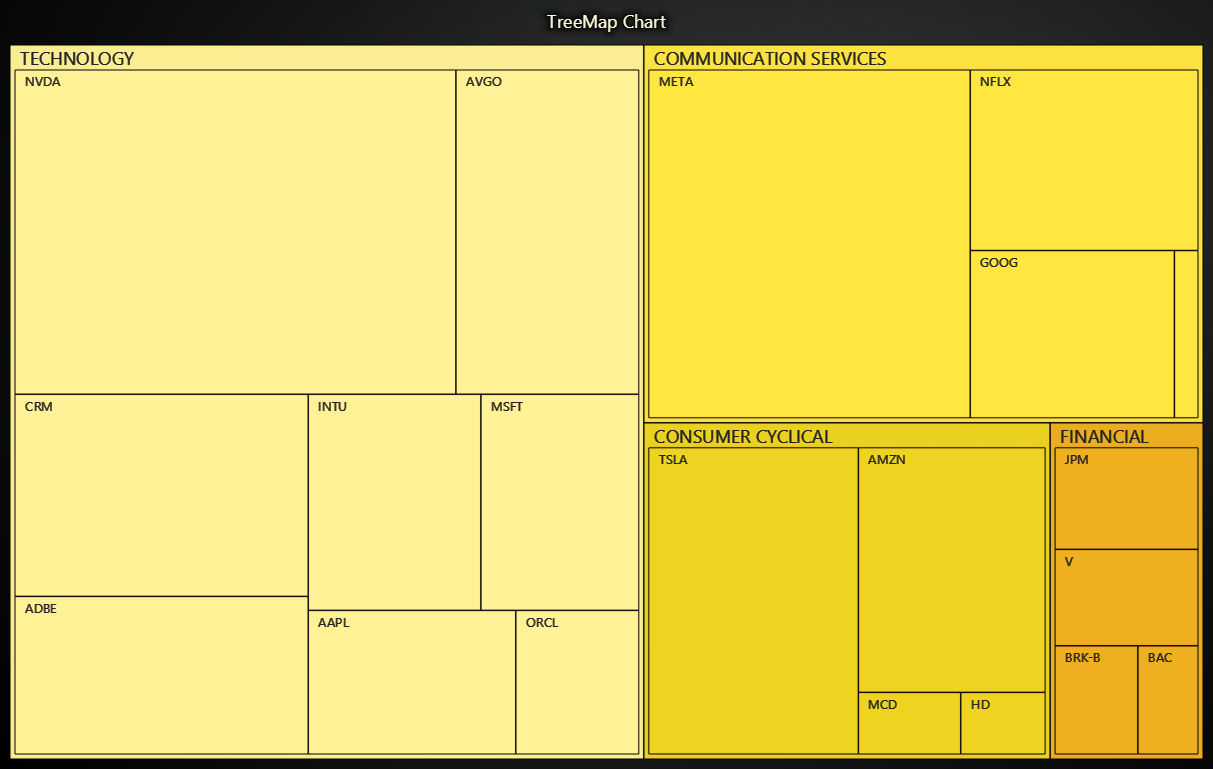
Creating TreeMap Chart
import lightningchart as lc

chart = lc.TreeMapChart(theme=lc.Themes.Light, title='TreeMap Chart')
Appearance Customization
Customize the look and layout of your Chart using the following methods.
Title
chart.set_title_color('#3498db')
chart.set_title_font(size=20, weight='bold')
chart.set_title_margin(10)
chart.set_title_rotation(0)
chart.set_title_effect(True)
Padding
Adjusts the space around the chart's plot area.
chart.set_padding(10)  # Uniform padding
chart.set_padding(left=10, top=15)  # Specific sides
chart.set_padding(left=10, top=15, right=20, bottom=25)  # All sides
Background Color
Sets the background fill color of the chart.
chart.set_background_color("#ffffff")
Background Stroke
Defines the border (stroke) around the chart's background.
chart.set_background_stroke(2, "#cccccc")
Data & Display Levels
# Define your data as a list of { name, value, children } objects
chart.set_data([
    {
        'name': 'TECHNOLOGY',
        'children': [
            {'name': 'MSFT', 'value': 60.34},
            {'name': 'AAPL', 'value': 52.75},
            {'name': 'ORCL', 'value': 31.25},
        ],
    }
])

# Only show two levels deep (root + immediate children)
chart.set_displayed_levels_count(2)
Header & Path Controls
# Change the font of each section's header
chart.set_header_font(
    size=16,
    family="Verdana, sans-serif",
    style="normal",
    weight="bold"
)

# Text for the “back to root” button when drilling down
chart.set_init_path_button_text("Back to Top")
Animations & Highlighting
# Animate the highlight when hovering or selecting nodes
chart.set_animation_highlight(True)

# Animate the layout changes when resizing or changing data
chart.set_animation_values(enabled=True, speed_multiplier=1.2)
Color Mapping & Styling
# Apply a palette that transitions from light blue to dark blue based on node value
chart.set_node_coloring(
    steps=[
        {"value": 0,    "color": '#D0E7FF'},
        {"value": 5000, "color": '#003F7F'}
    ],
    look_up_property="value",
    interpolate=True
)

# With formatted legend display:
chart.set_node_coloring(
    steps=[
        {'value': 0, 'color': '#0000FF'},
        {'value': 100, 'color': '#FF0000'},
    ],
    look_up_property='value',
    formatter_precision=2,           # Decimal places
    formatter_unit='mag',             # Unit suffix
    formatter_scale=1.5,              # Scale values
    formatter_type='scientific',      # 'standard', 'compact', 'engineering', 'scientific'
    formatter_operation='floor',      # 'none', 'round', 'ceil', 'floor'
)

# Change the text color of the breadcrumb path labels
chart.set_path_label_color('#333333')
chart.set_path_label_font(size=12, weight="medium")

# Header text color for each rectangle
chart.set_header_color('#FFFFFF')

# Node label font and fill color
chart.set_label_font(size=10, style="italic")
chart.set_label_color('#000000')
Borders & Effects
# Outline each node with a 1px gray border
chart.set_node_border_style(1, '#CCCCCC')

# Enable theme effects like drop-shadow on nodes
chart.set_node_effect(True)

# Control how the chart cursor behaves when hovering
chart.set_cursor_mode("show-nearest-interpolated")
Drill-down Navigation
Focus the view on a branch of the hierarchy or return to the root.
# Go to a top-level node by name
chart.set_drill_down_node('TECHNOLOGY')

# Go to a nested node by full path
chart.set_drill_down_node(['TECHNOLOGY', 'MSFT'])

# Reset the view back to the root
chart.set_drill_down_node(None)
Set Padding
# To set padding around the chart in pixels
chart.set_padding(left=10, top=15, right=20, bottom=25)
Disable/Enable Animations
# To disable or enable all animations of the Chart
chart.set_animations_enabled(False)
Coordinate Transformation
Please refer to Coordinate Transformation section.
Add TextBox
Please see common TextBox section.
Cursors
Please see common Cursors section.
Legend
Please see common legend section.
User Interactions
Please see common User Interactions section.