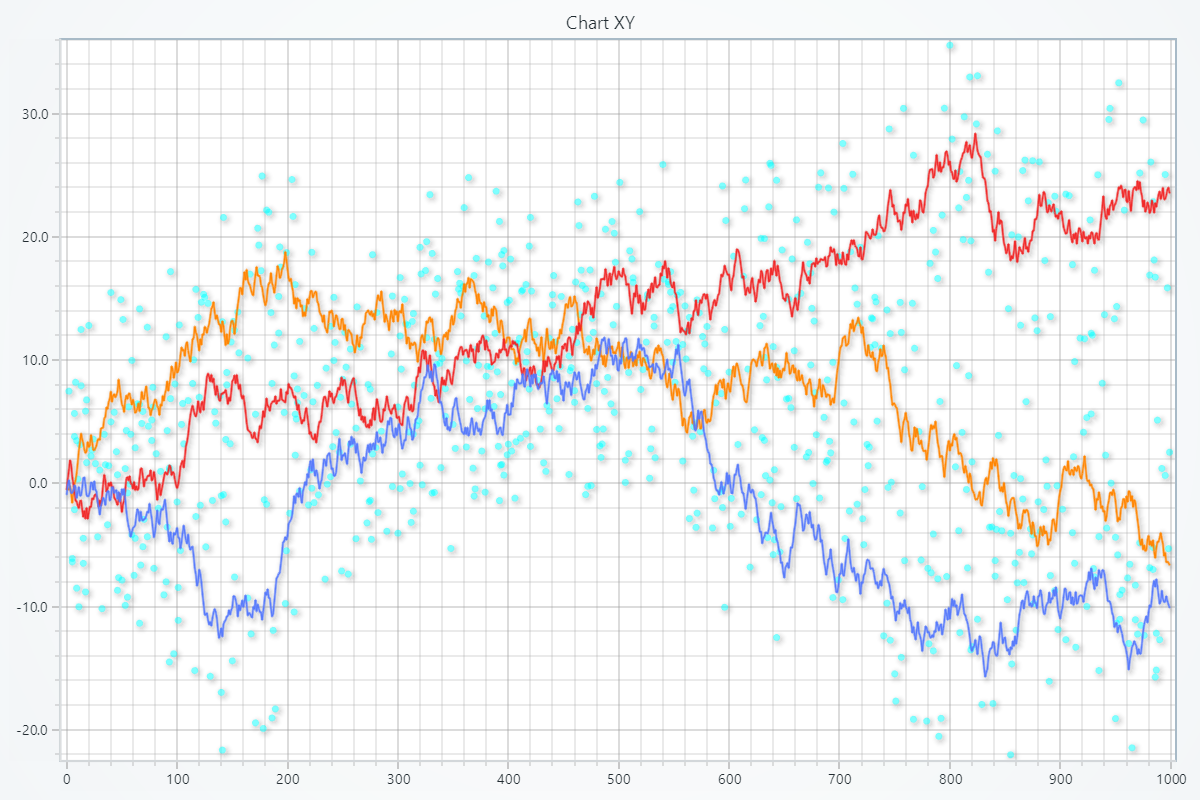
XY Chart
Chart type for visualizing data between two dimensions, X and Y. It has built-in Axis functionality, and supports a large set of series types, including:
- Lines
- Point Line
- Spline
- Step
- Scatter points
- Heatmap
- Scrolling Heatmap
- Areas
- Area Range
- Box Plot
- Figures
Creating ChartXY
import lightningchart as lc

chart = lc.ChartXY(title='ChartXY', theme=lc.Themes.Light)
Chart Title
Control title, text, style, position, and visibility of the chart.
# Set or update the chart title
chart.set_title("My Custom Title")

# Change title color
chart.set_title_color('#FF0000')

# Adjust title font (size, family, weight, style)
chart.set_title_font(size=18, family="Arial, sans-serif", weight="bold", style="italic")

# Set padding below the title
chart.set_title_margin(10)

# Rotate title by 45°
chart.set_title_rotation(45)

# Apply theme effect (e.g. drop shadow)
chart.set_title_effect(True)

# Move title to the top-left corner
chart.set_title_position("left-top")

# Hide title altogether
chart.hide_title()
Chart Background
Customize chart background.
# Solid background color
chart.set_background_color('#D80A0A')

# Background border/stroke
chart.set_background_stroke(2, 'red')

# Static background image
chart.set_chart_background_image("D:/images/chart_bg.jpg", fit_mode="Tile")

# Background video
chart.set_chart_background_video("D:/videos/bg.mp4", fit_mode="Center")
Series Background
Customize series background.
# Enable or disable background effect
chart.set_series_background_effect(True)

# Solid fill behind series
chart.set_series_background_color('#FFFFFF')

# Use an image as series background
chart.set_series_background_image("https://example.com/bg.png", fit_mode="Fill")

# Or a looping video
chart.set_series_background_video("D:/path/to/local_video.mp4", fit_mode="Fit")
Set Padding
# To set padding around the chart in pixels
chart.set_padding(left=10, top=15, right=20, bottom=25)
Enable/Disable Animations
# To disable or enable all animations of the Chart
chart.set_animations_enabled(True)
Coordinate Transformation
LightningChart Python has a number of different coordinate systems that are not natively present on a web page - most importantly, the chart's Axes.
In many data visualization use cases it is critical to add annotations or markers at specific coordinates along the Axes and data series. Because of this, the ability to translate between coordinates on the web page and the axes is critical.
In this context, "client" refers to the Web API Client coordinate system.
# Client screen coordinates to axis values
axis_coords = chart.translate_coordinate(
    {'clientX': 500, 'clientY': 300},
    target='axis',
    source='client'
)

# Axis values to relative coordinates
relative_coords = chart.translate_coordinate(
    {'x': 50, 'y': 100},
    target='relative',
    source='axis'
)
Apart from the widely used "axis" and "client" coordinate system, there is another, the "relative" coordinate system. This is mostly utilized for LightningChart UI components that are positioned as pixel locations relative to the chart (e.g. 10 pixels from left edge etc.).
# Relative coordinates to client screen position
client_coords = chart.translate_coordinate(
    {'x': 400, 'y': 300},
    target='client',
    source='relative'
)

# client → relative → client
relative = chart.translate_coordinate({'clientX': 100, 'clientY': 200}, target='relative', source='client')
back_to_client = chart.translate_coordinate(relative, target='client', source='relative')
- axis: Data values along chart axes (e.g., time, temperature)
- client: Pixel position in browser viewport
- relative: Pixels relative to chart edges (for UI positioning)
solve_nearest
Interactively read back the data point that is closest to a screen coordinate (or to the last mouse position) while the chart is open in live mode.
# Query the data point nearest to client pixel (400, 300).
hits = chart.solve_nearest(client_x=400, client_y=300, solve_mode='show-nearest')
for entry in hits:
    print(entry.get('series'), entry.get('x'), entry.get('y'))

# Omitting client_x / client_y reuses the last mouse position.
hover_hits = chart.solve_nearest(solve_mode='show-all')
client_x/client_yare browser client pixels. When either is omitted, LightningChart uses the last pointer location over the chart.solve_modeaccepts'show-nearest','show-nearest-interpolated','show-pointed','show-pointed-interpolated','show-all', or'show-all-interpolated'.- Each result dictionary contains the snapped
x,y, detectedcolor, and the associatedseriesname so you can highlight or annotate the hit.
swap_axes
Reorder stacked Y axes dynamically without re-creating them. This is helpful when multiple series need to change vertical order based on user interactions.
# Swap Axis 1 and Axis 2.
chart.swap_axes(axis1, axis2)
Add TextBox
Please see common TextBox section.
Cursors
Please see common Cursors section.
Legend
Please see common legend section.
User Interactions
Please see common User Interactions section.