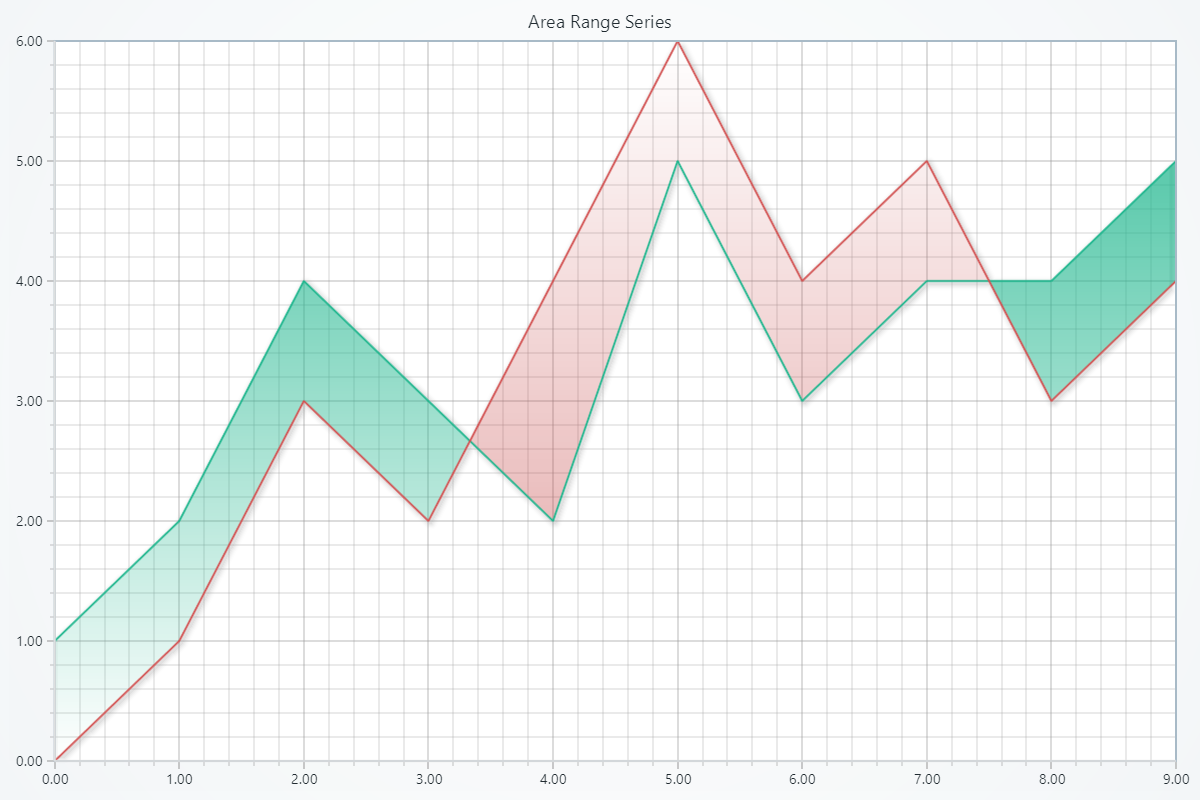
Area Range
Series for visualizing a collection of progressive area points which consist of one X-value and two Y-values; high and low values.
Creating Area Range series
series = chart.add_area_range_series()
Adding Data
Adds two arrays—one for high values and one for low values:
# Define high and low value arrays:
high_values = [10, 15, 12, 18]
low_values  = [5,  8,  6,  10]

# Add these arrays to the Area Range series, starting at X=0 with a step of 1:
series.add_arrays_high_low(high=high_values, low=low_values, start=0, step=1)
Please refer to Adding Data to Charts section to see other available ways of adding data to a series.
Customizing Fill Coloring
High Area Styling
Solid Fill Colors
# Set the high area fill to red:
series.set_high_fill_color((255, 0, 0))
series.set_high_fill_color('#FF0000')
series.set_high_fill_color('red')
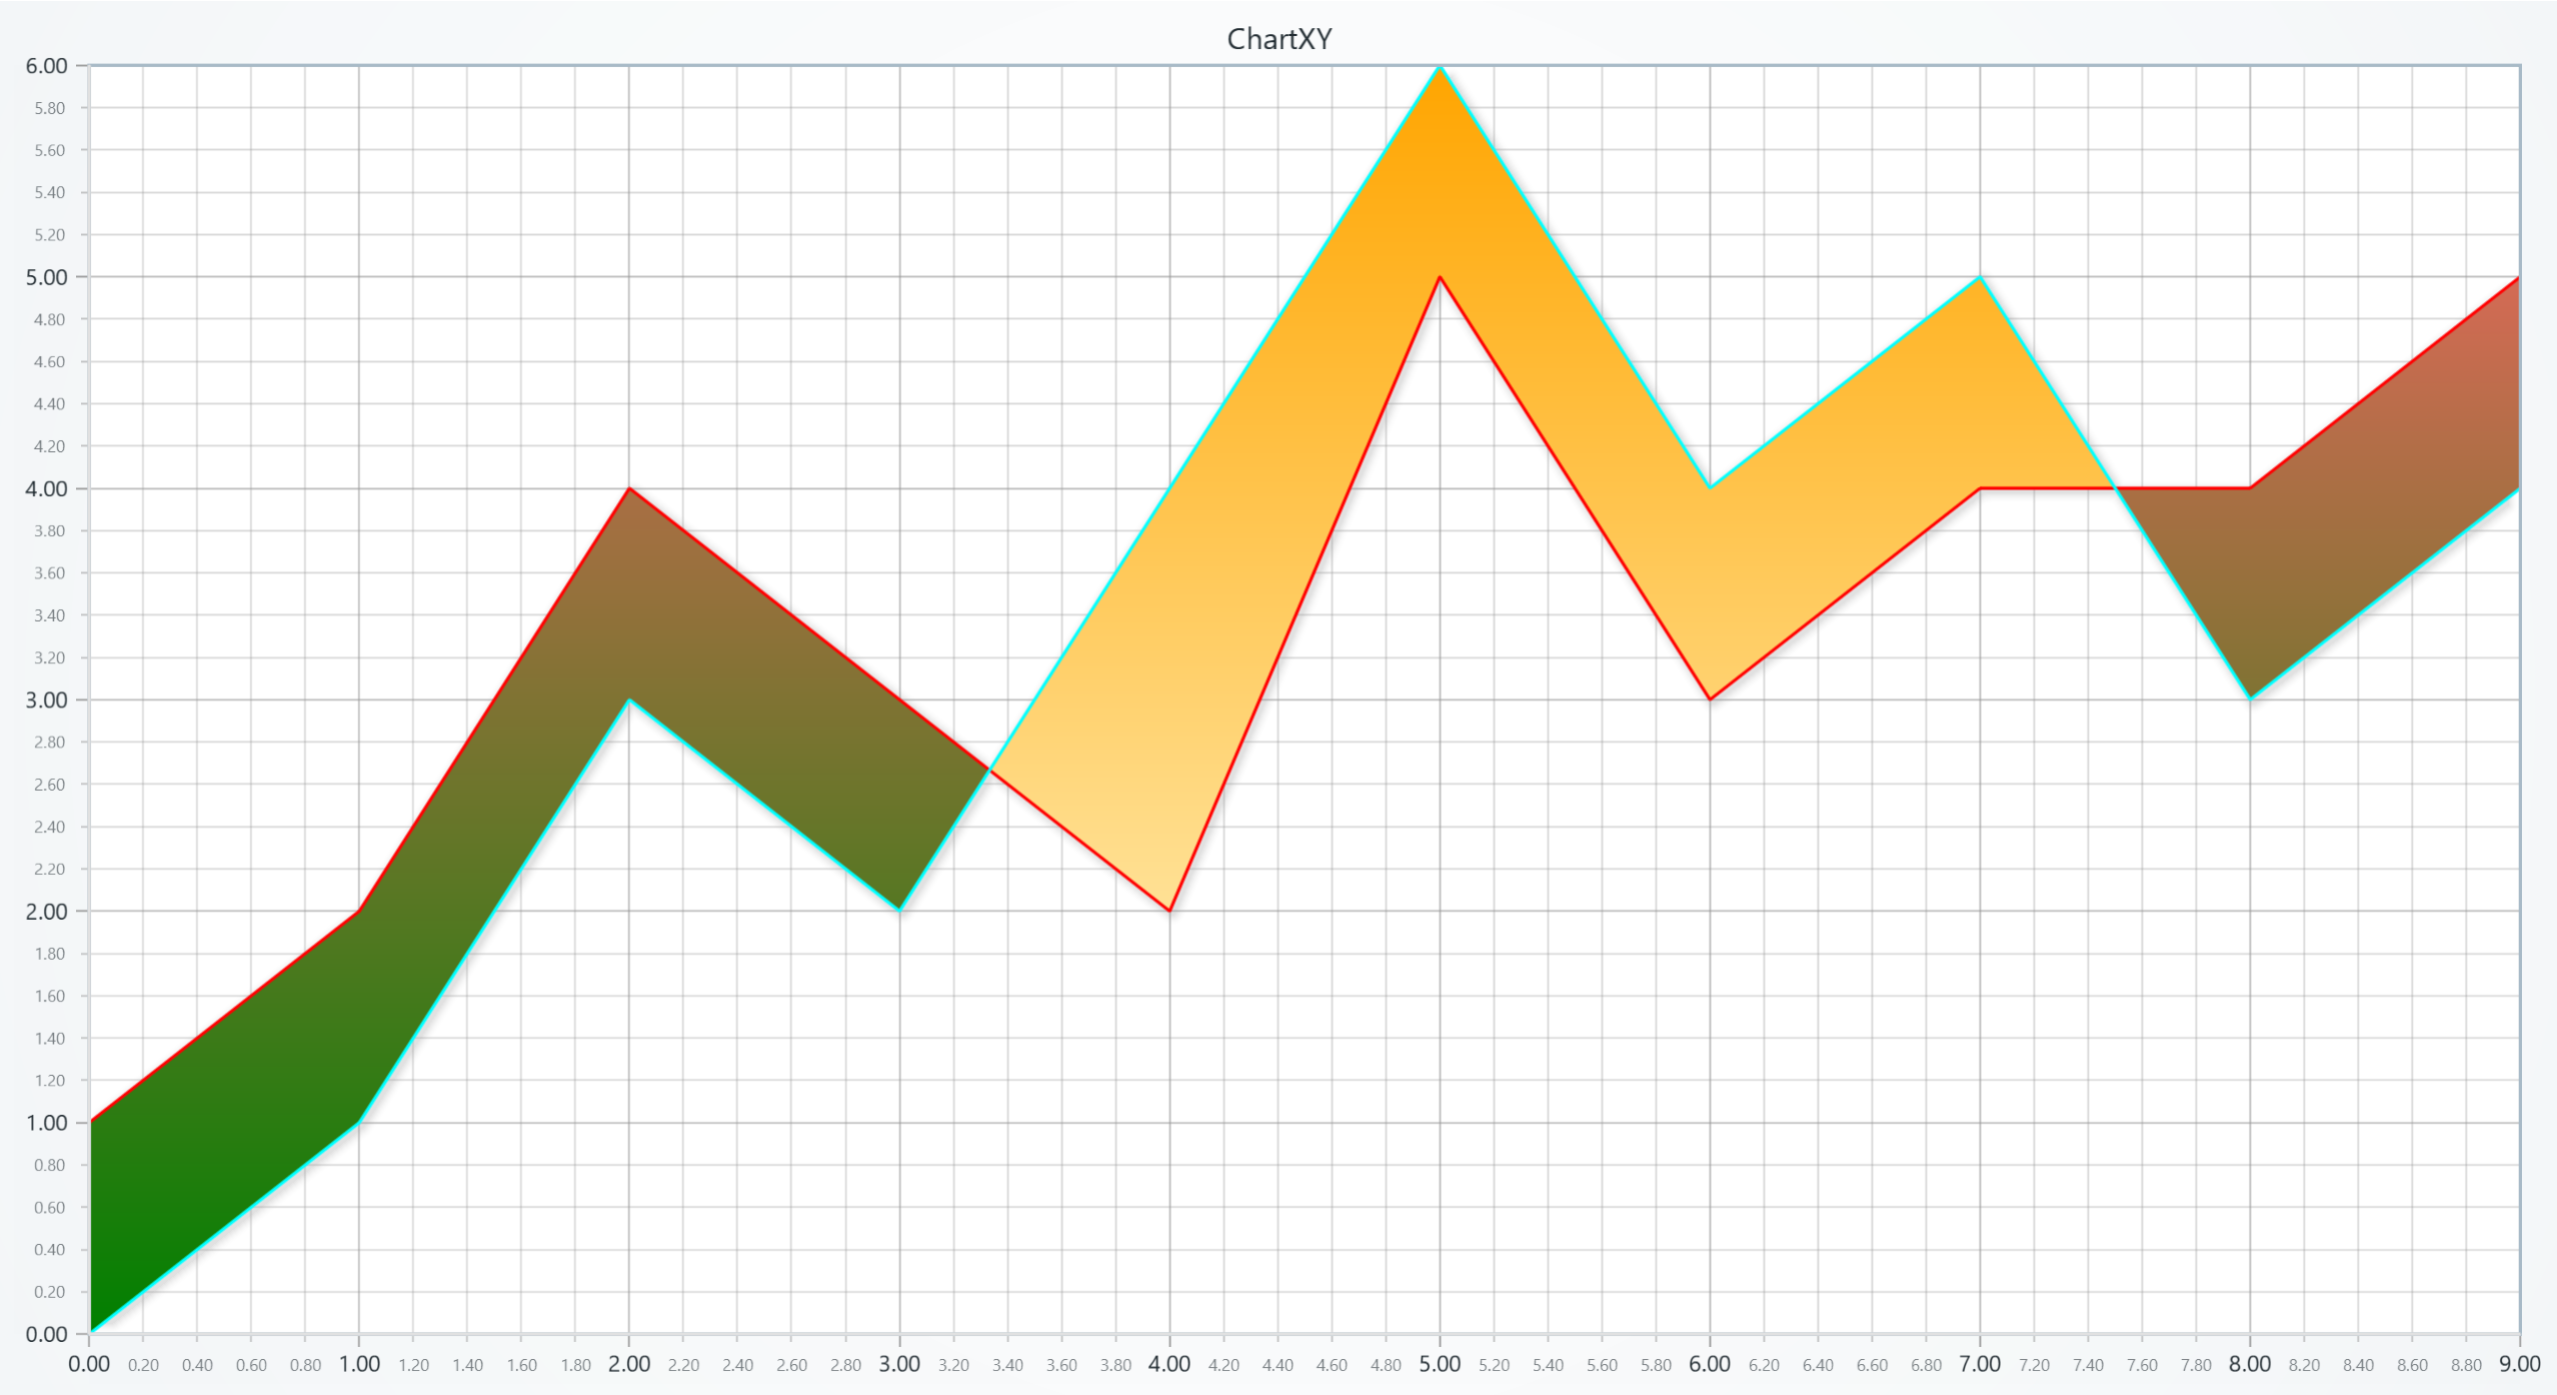
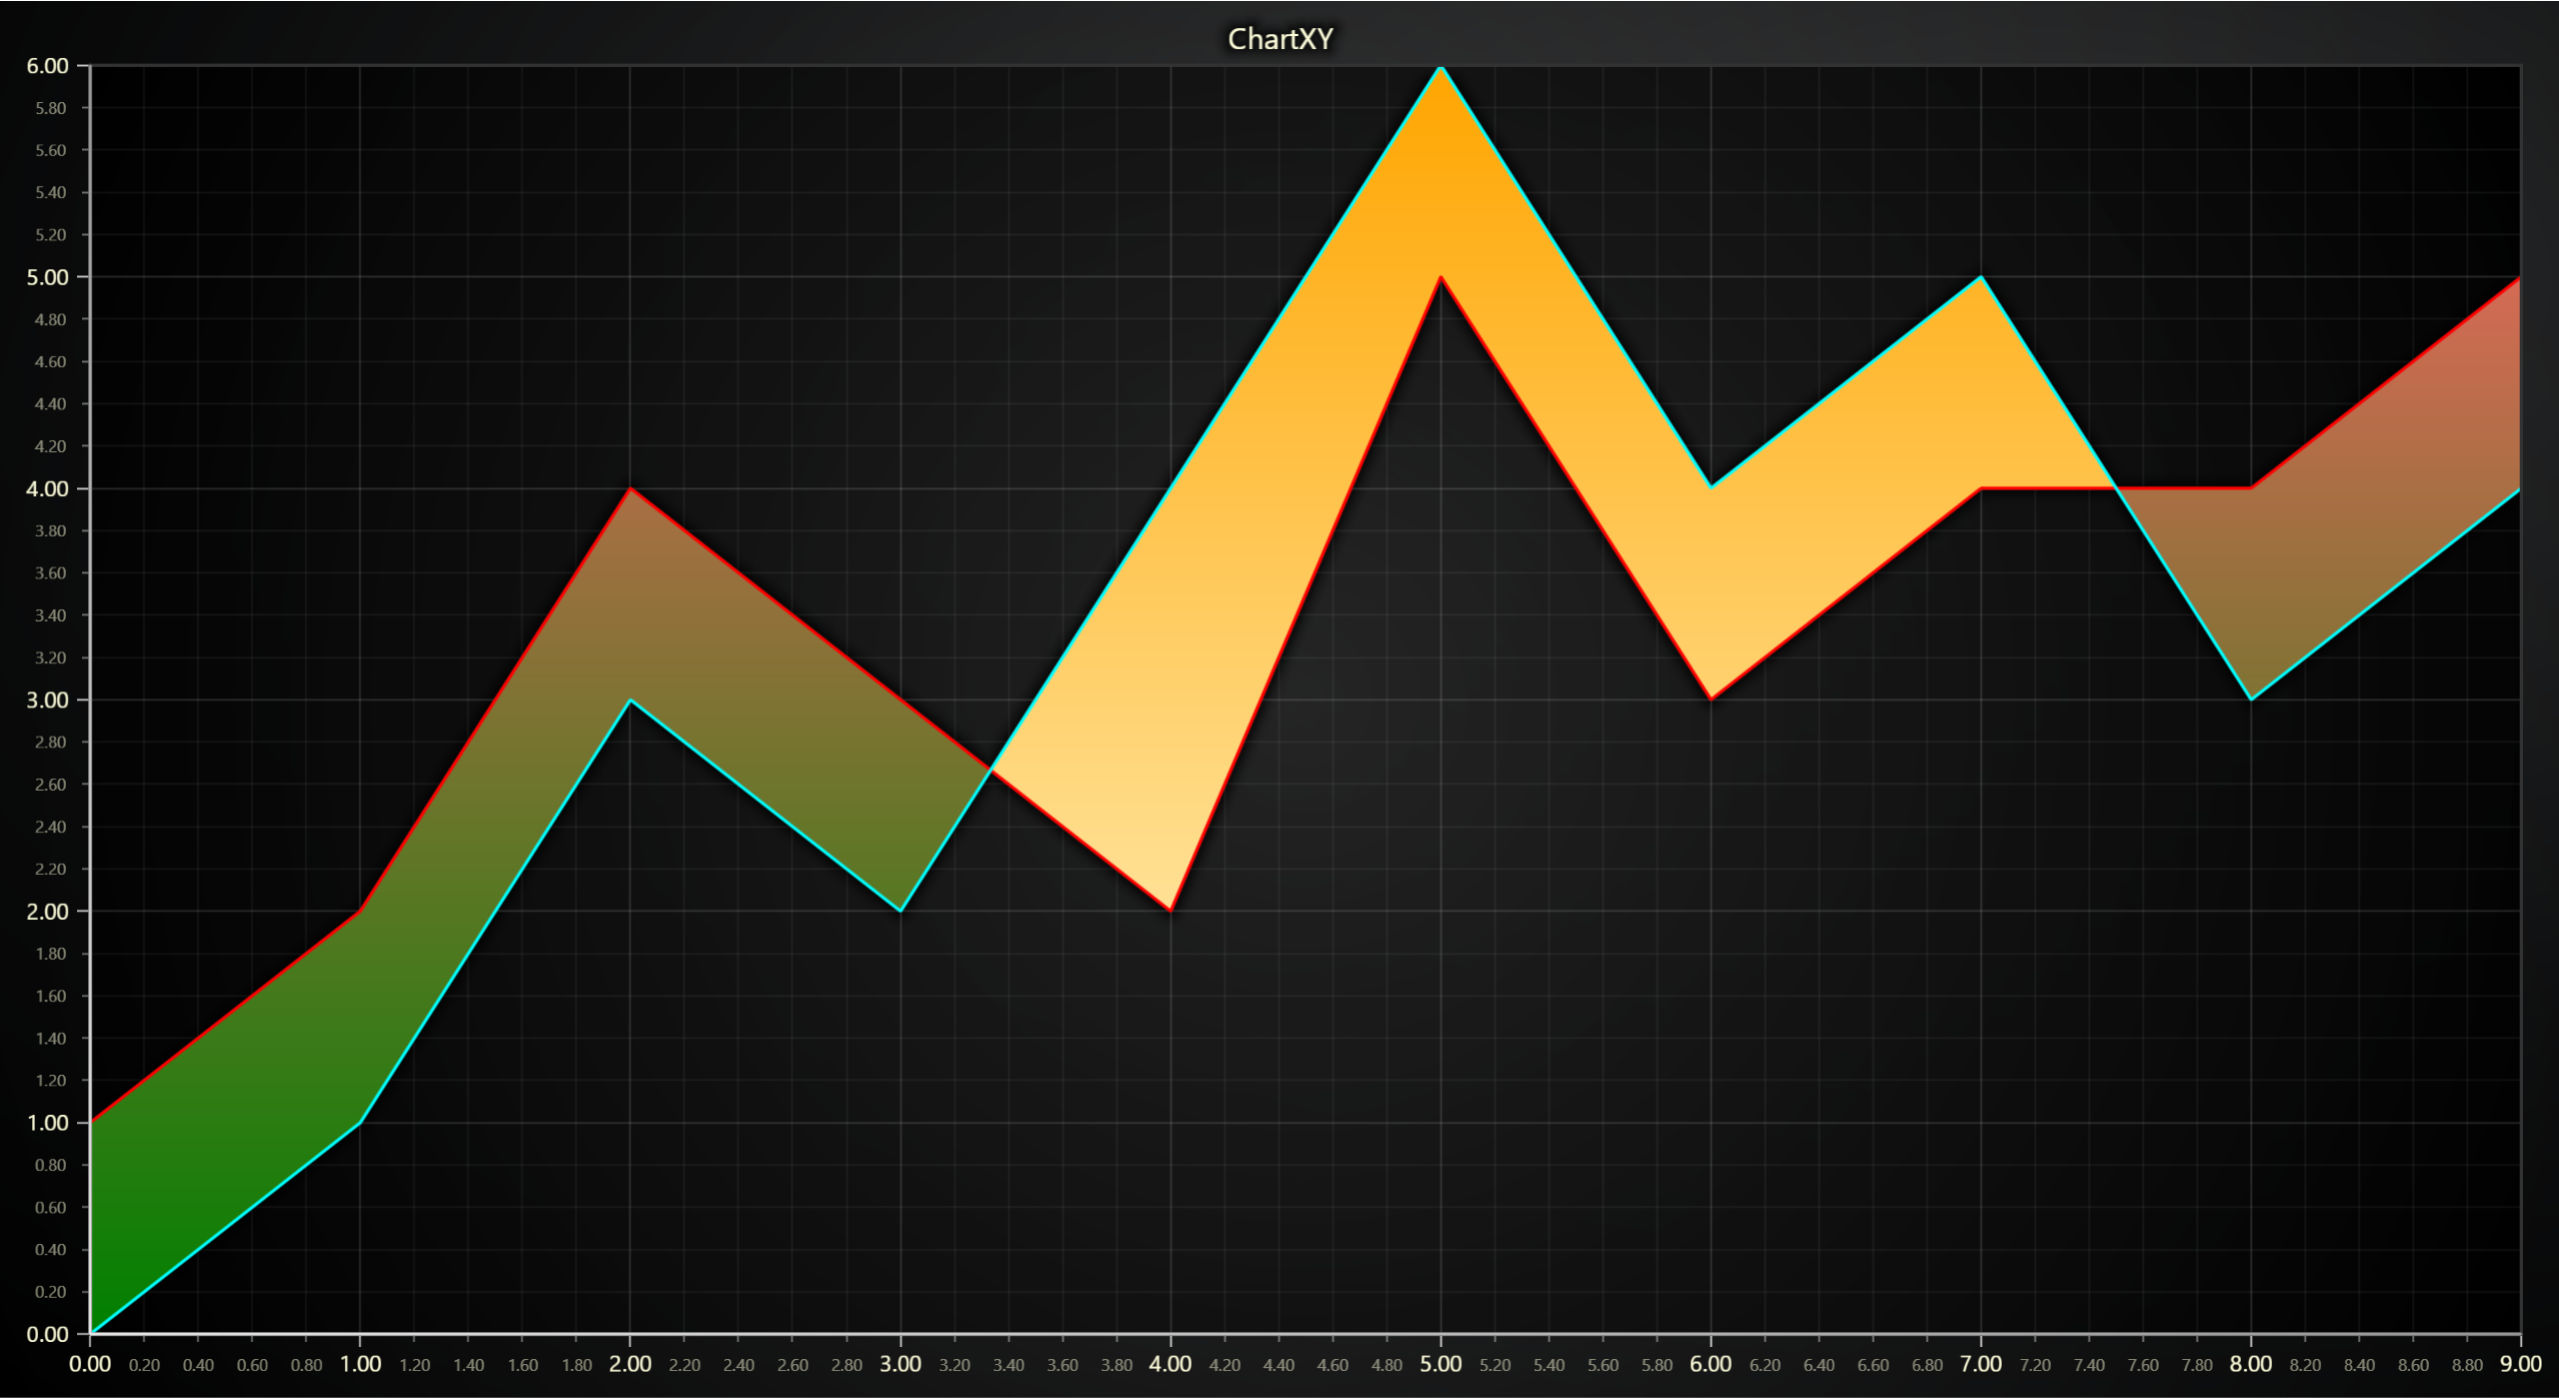
Set Palette Coloring
# Create a palette for the high area:
series.set_high_palette_coloring(
    steps=[
        {'value': 0, 'color': 'green'},
        {'value': 6, 'color': (255, 102, 102)},
    ],
    look_up_property='y',
    interpolate=True,
)

# Create a palette for the high area with formatted legend display:
series.set_high_palette_coloring(
    steps=[
        {'value':0 , 'color':'#fff000'},
        {'value':5 , 'color':"#13c425"},
        {'value':10 , 'color':"#db3c07"},
    ],
    look_up_property='y',
    formatter_operation='floor',
    formatter_scale=1,
    formatter_precision=2,
    formatter_type='compact',
    formatter_unit='mag',
)
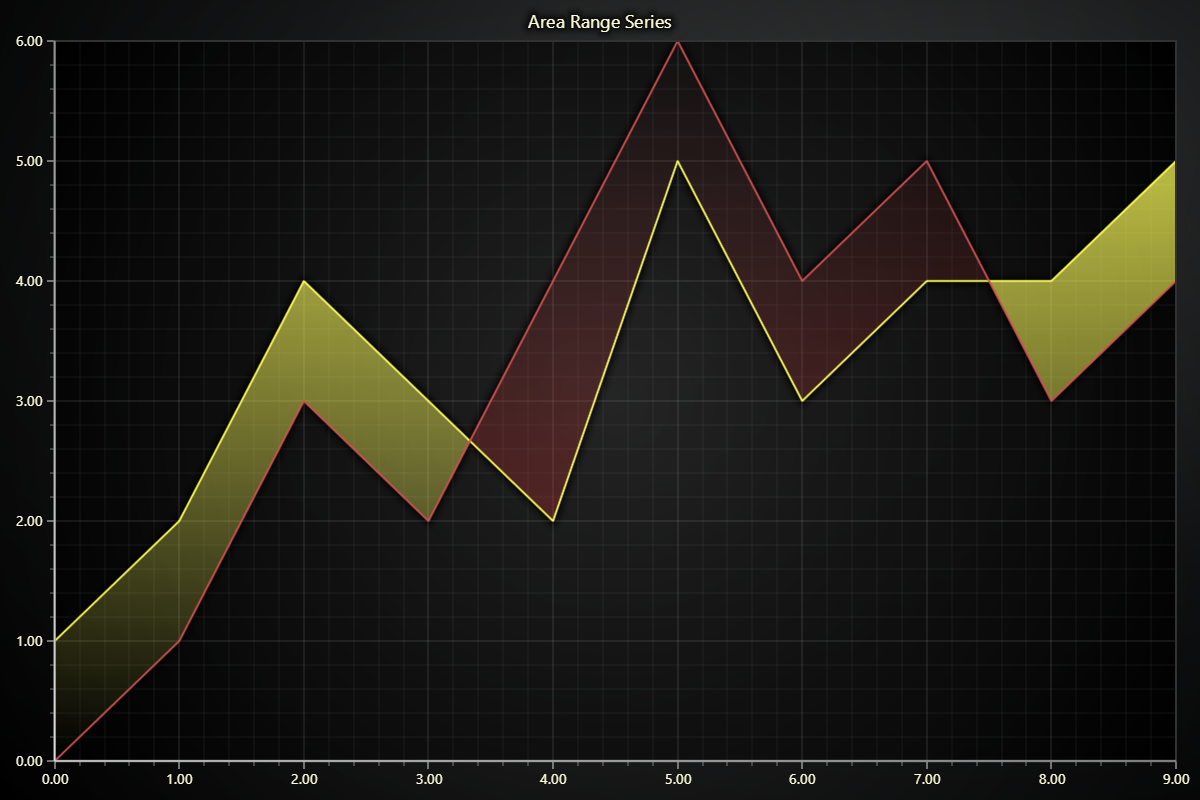
Set Stroke Style
# Set a 2px thick red stroke for the high area:
series.set_high_stroke(2, 'red')
Low Area Styling
Solid Fill Color
# Set the low area fill to red:
series.set_low_fill_color((255, 0, 0))
series.set_low_fill_color('#FF0000')
series.set_low_fill_color('red')
Set Palette Coloring
# Create a palette for the low area:
series.set_low_palette_coloring(
    steps=[
        {'value': 0, 'color': '#FFFFE0', 'label':'Low'},
        {'value': 3, 'color': 'yellow'},
        {'value': 6, 'color': 'orange', 'label':'High'},
    ],
    look_up_property='y',
    interpolate=True,
)

# Create a palette for the low area with formatted legend display:
series.set_low_palette_coloring(
    steps=[
        {'value':0 , 'color':'#fff000'},
        {'value':5 , 'color':"#13c425"},
        {'value':10 , 'color':"#db3c07"},
    ],
    look_up_property='y',
    formatter_operation='floor',
    formatter_scale=1,
    formatter_precision=2,
    formatter_type='compact',
    formatter_unit='mag',
)
Set Stroke style
# Set a 2px thick red stroke for the low area:
series.set_low_stroke(2, 'red')
Series Utility Methods
This section works the same as for Line, to avoid duplication of guides, please refer to the section under Line
Legend
Please see common legend section.