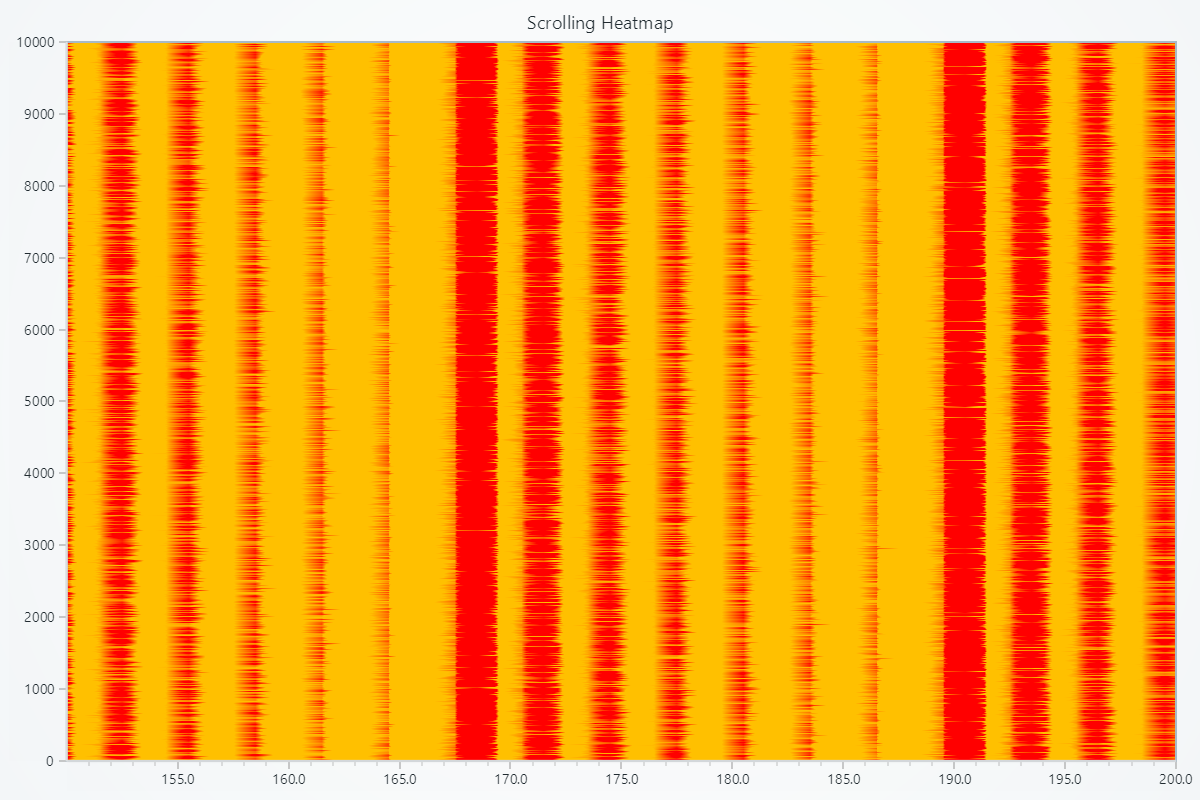
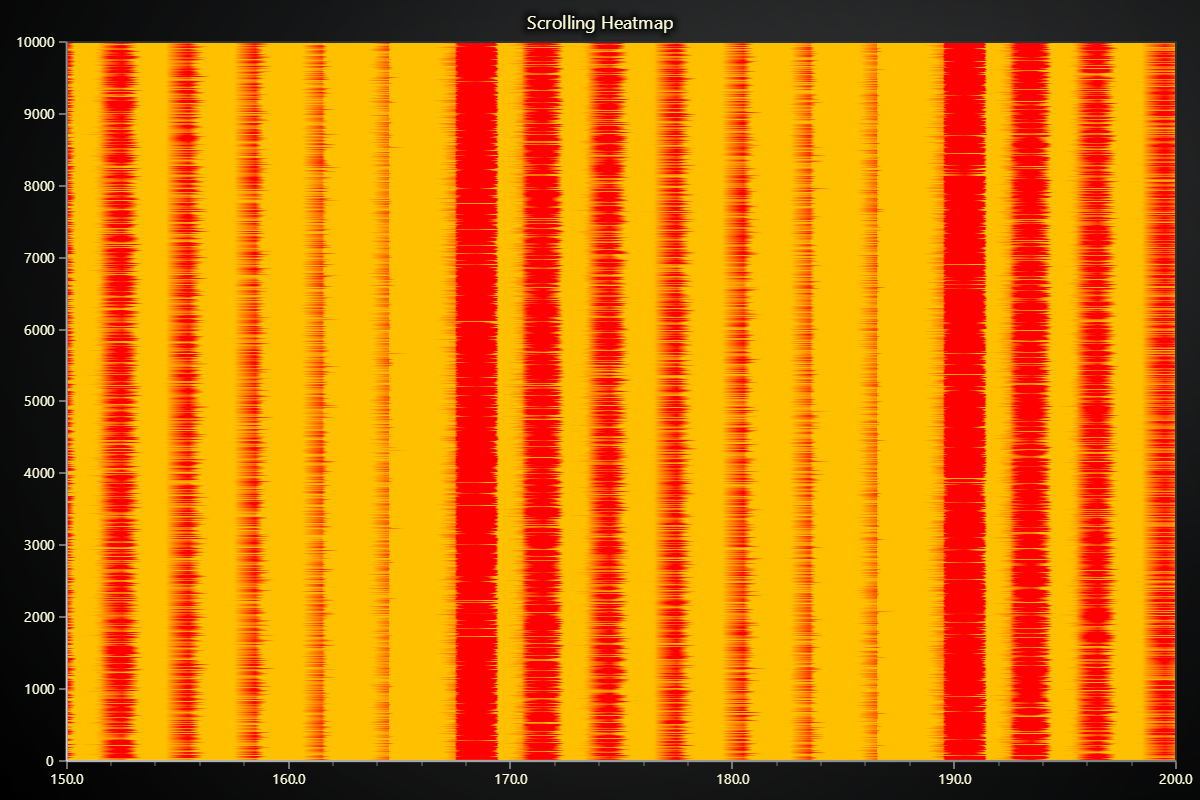
Scrolling Heatmap
Scrolling heatmaps can be created with Heatmap Scrolling Grid Series, which has an API for pushing data in a scrolling manner (append new data on top of existing data).
Creating Scrolling Heatmap
series = chart.add_heatmap_scrolling_grid_series(resolution=10000, scroll_dimension='columns')
Positioning and Pixel Configuration
These methods allow you to define the spatial positioning of heatmap samples and control bilinear interpolation on each pixel.
Set Start Coordinate
# Set the start coordinate to (0, 0)
series.set_start(x=0, y=0)
Set Step Between Samples
# Set the step between samples to 10 in X and 5 in Y
series.set_step(x=10, y=5)
Set Pixel Interpolation
# Enable smooth pixel interpolation:
series.set_pixel_interpolation(True)
Add Intensity Values
Append new rows of intensity data to enable scrolling visualization. Older data scrolls out as new data is added.
# Append a new row to the scrolling heatmap
new_row = [0.1, 0.2, 0.3, 0.4, 0.5]
series.add_intensity_values([new_row])
Customizing Fill Coloring
Set Palette Coloring
import lightningchart as lc

# Create a palette that transitions from blue to red:

series.set_palette_coloring(
    steps=[
        {'value': 0, 'color': '#0000FF'},
        {'value': 50, 'color': 'red'}
    ],
    look_up_property='value',
    interpolate=True
)

# With formatted legend display:
series.set_palette_coloring(
    steps=[
        {'value': 0, 'color': '#0000FF'},
        {'value': 100, 'color': '#FF0000'},
    ],
    look_up_property='value',
    formatter_precision=2,           # Decimal places
    formatter_unit='mag',             # Unit suffix
    formatter_scale=1.5,              # Scale values
    formatter_type='scientific',      # 'standard', 'compact', 'engineering', 'scientific'
    formatter_operation='floor',      # 'none', 'round', 'ceil', 'floor'
)
Solid Fill Color
import lightningchart as lc

# Set the heatmap fill to a light gray:
series.set_color('#D3D3D3')
Removing Color
# Remove the fill color:
series.set_empty_color_fill()
Wireframe Configuration
Set Wireframe Stroke
import lightningchart as lc

# Set a wireframe with 2px thickness in black:
series.set_wireframe_stroke(thickness=2, color='black')
Hide Wireframe
# Hide the heatmap wireframe:
series.hide_wireframe()
Data Cleaning
Turns on automatic data cleaning, which can help manage memory by removing outdated or unused samples.
# Enable automatic data cleaning:
series.enable_data_cleaning(True)
Scrolling heatmap does not currently have a method to control maximum memory usage precisely. enable_data_cleaning effectively enables "lazy" data cleaning, which will prevent applications from running out of memory, but when this data cleaning exactly happens is not guaranteed.
Series Utility Methods
This section works the same as for Line, to avoid duplication of guides, please refer to the section under Line
Legend
Please see common legend section.