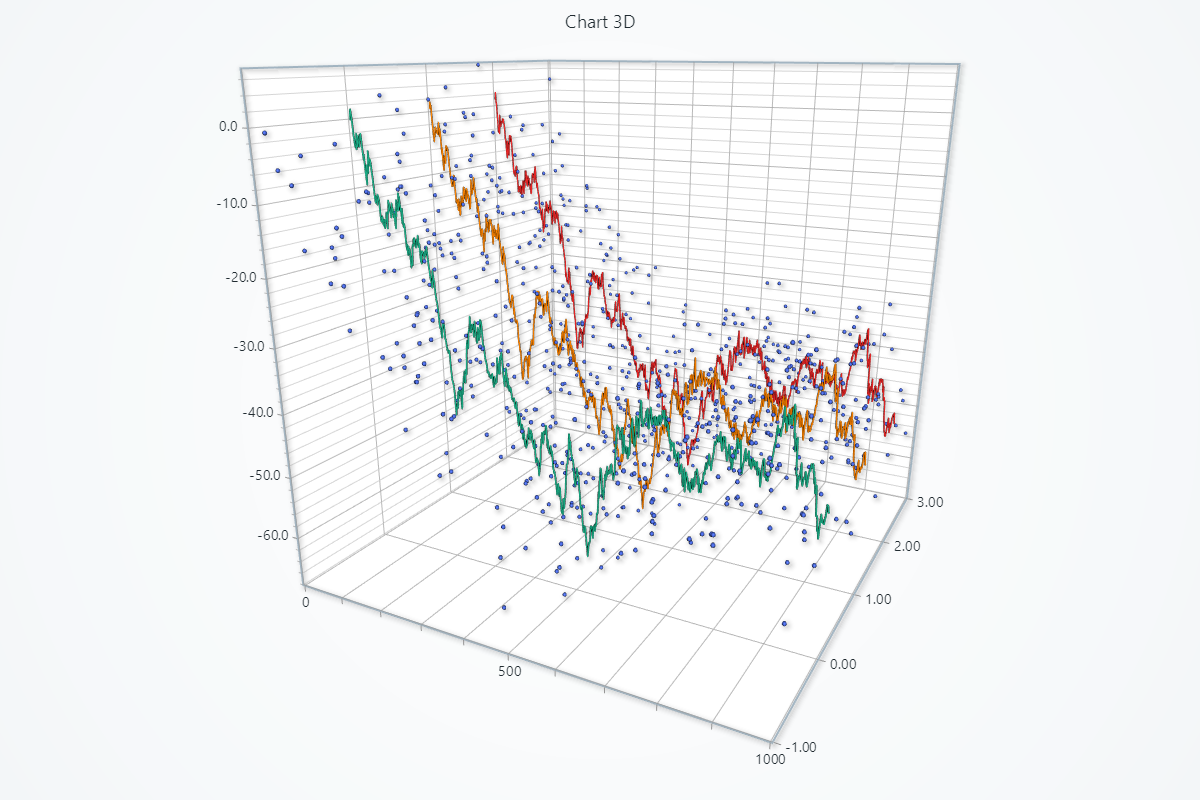
3D Chart
Chart for visualizing data in a 3-dimensional scene, with camera and light source(s). Camera can be moved around with user interactions (mouse & touch). It is always oriented to face the center of the scene. Light source is always located at the location of the Camera, and directed towards the center of Axes. Data can be added to the Chart via various Series types, each with their own method of visualization:
Creating Chart3D
import lightningchart as lc

chart = lc.Chart3D(title='Chart3D', theme=lc.Themes.Light)
Appearance Customization
Customize the look and layout of your Chart using the following methods.
Title
chart.set_title_color('#3498db')
chart.set_title_font(size=20, weight='bold')
chart.set_title_margin(10)
chart.set_title_rotation(0)
chart.set_title_effect(True)
Padding
Adjusts the space around the chart's plot area.
chart.set_padding(10)  # Uniform padding
chart.set_padding(left=10, top=15)  # Specific sides
chart.set_padding(left=10, top=15, right=20, bottom=25)  # All sides
Background Color
Sets the background fill color of the chart.
chart.set_background_color("#ffffff")
Background Stroke
Defines the border (stroke) around the chart's background.
chart.set_background_stroke(2, "#cccccc")
Series Background
Customize series background.
# Enable or disable background effect
chart.set_series_background_effect(True)

# Solid fill behind series
chart.set_series_background_color('#FFFFFF')
Scene & Bounding Box
Control zoom animation and the 3D scene's bounding box dimensions and styling:
# Enable or disable smooth zoom animations
chart.set_animation_zoom(True)

# Adjust the relative size of the 3D bounding box (x, y, z ratios)
#   default is (1.0, 1.0, 1.0)
chart.set_bounding_box(x=1.5, y=1.0, z=0.8)

# Style the bounding box edges (thickness in px)
chart.set_bounding_box_stroke(thickness=2, color="#888888")
Camera angle and distance
Camera angle and viewpoint can be controlled with set_camera_location method:
chart.set_camera_location(x=1.0, y=1.0, z=2.0)
By default, this only controls the location of the camera. It always points towards the center of the scene at a preset distance away from the center.
If control over camera distance is needed, then set_camera_automatic_fitting_enabled method can be used:
chart.set_camera_automatic_fitting_enabled(False)
Disable/Enable animations
# To disable or enable all animations of the Chart
chart.set_animations_enabled(True)
Coordinate Transformation
Chart3D has multiple coordinate systems for positioning 3D objects and projecting them to 2D screen space. Coordinate transformation is essential for placing annotations at specific data points or converting mouse clicks to 3D positions.
# Axis coordinates to world coordinates
world_coords = chart.translate_coordinate(
    {'x': 10, 'y': 20, 'z': 30},
    target='world',
    source='axis'
)

# World coordinates back to axis values
axis_coords = chart.translate_coordinate(
    {'x': 0, 'y': 0, 'z': 0},
    target='axis',
    source='world'
)
For 2D projections (converting 3D positions to screen coordinates):
# Axis coordinates to client (2D screen position)
client_coords = chart.translate_coordinate(
    {'x': 10, 'y': 20, 'z': 30},
    target='client',
    source='axis'
)

# World coordinates to relative (2D pixels from chart edges)
relative_coords = chart.translate_coordinate(
    {'x': 0, 'y': 0, 'z': 0},
    target='relative',
    source='world'
)
- axis: Data values along X, Y, Z axes (e.g., temperature, pressure, time)
- world: 3D scene coordinates (rotated/scaled from axis)
- client: 2D screen pixel position in browser viewport
- relative: 2D pixels relative to chart edges (for UI positioning)
Add TextBox
Please see common TextBox section.
Cursors
Please see common Cursors section.
Legend
Please see common legend section.
User Interactions
Please see common User Interactions section.