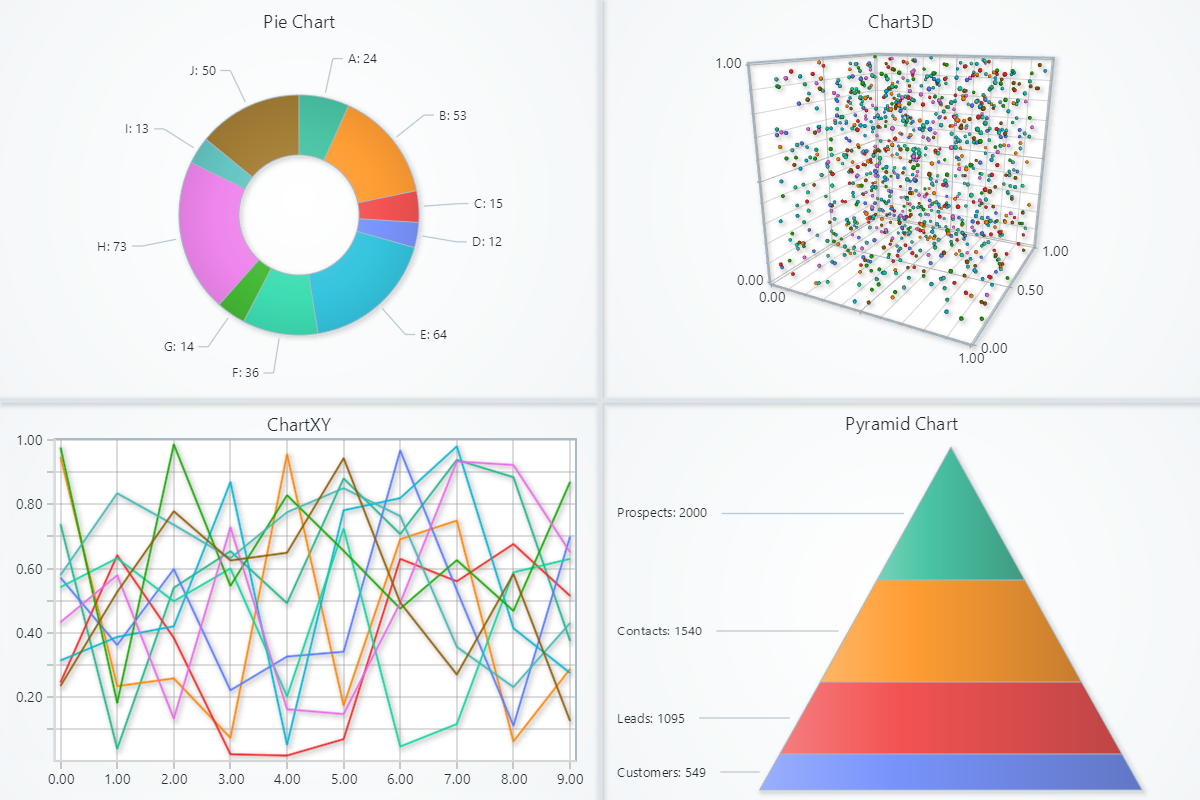
Dashboard
Dashboard is a component for flexible positioning of multiple Charts efficiently in the same rendering view.
Dashboards are created with the ligtningchart reference. Upon its creation, number of columns and rows must be
specified.
Charts can then be placed in dashboard cells with column and row indexes and spans:
import lightningchart as lc
import random

lc.set_license('my-license-key')

pyramid_data = [
    {'name': 'Prospects', 'value': 2000},
    {'name': 'Contacts', 'value': 1540},
    {'name': 'Leads', 'value': 1095},
    {'name': 'Customers', 'value': 549}
]
pie_data = [
    {'name': 'A', 'value': 24}, {'name': 'B', 'value': 53},
    {'name': 'C', 'value': 15}, {'name': 'D', 'value': 12},
    {'name': 'E', 'value': 64}, {'name': 'F', 'value': 36},
    {'name': 'G', 'value': 14}, {'name': 'H', 'value': 73},
    {'name': 'I', 'value': 13}, {'name': 'J', 'value': 50},
]

# Initialize a Dashboard with 2 rows and columns
dashboard = lc.Dashboard(columns=2, rows=2, theme=lc.Themes.Light)

# Add charts to the dashboard
pie_chart = dashboard.PieChart(column_index=0, row_index=0)
pyramid_chart = dashboard.PyramidChart(column_index=1, row_index=1)
chart3d = dashboard.Chart3D(column_index=1, row_index=0)
chartxy = dashboard.ChartXY(column_index=0, row_index=1)

pie_chart.add_slices(pie_data)
pie_chart.set_inner_radius(50)

pyramid_chart.add_slices(pyramid_data)

for i in range(10):
    chart3d.add_point_series().add(
        x=[random.random() for _ in range(100)],
        y=[random.random() for _ in range(100)],
        z=[random.random() for _ in range(100)],
    )
    chartxy.add_line_series().add(
        x=list(range(0, 10)),
        y=[random.random() for _ in range(10)],
    )

# Open the dashboard
dashboard.open()
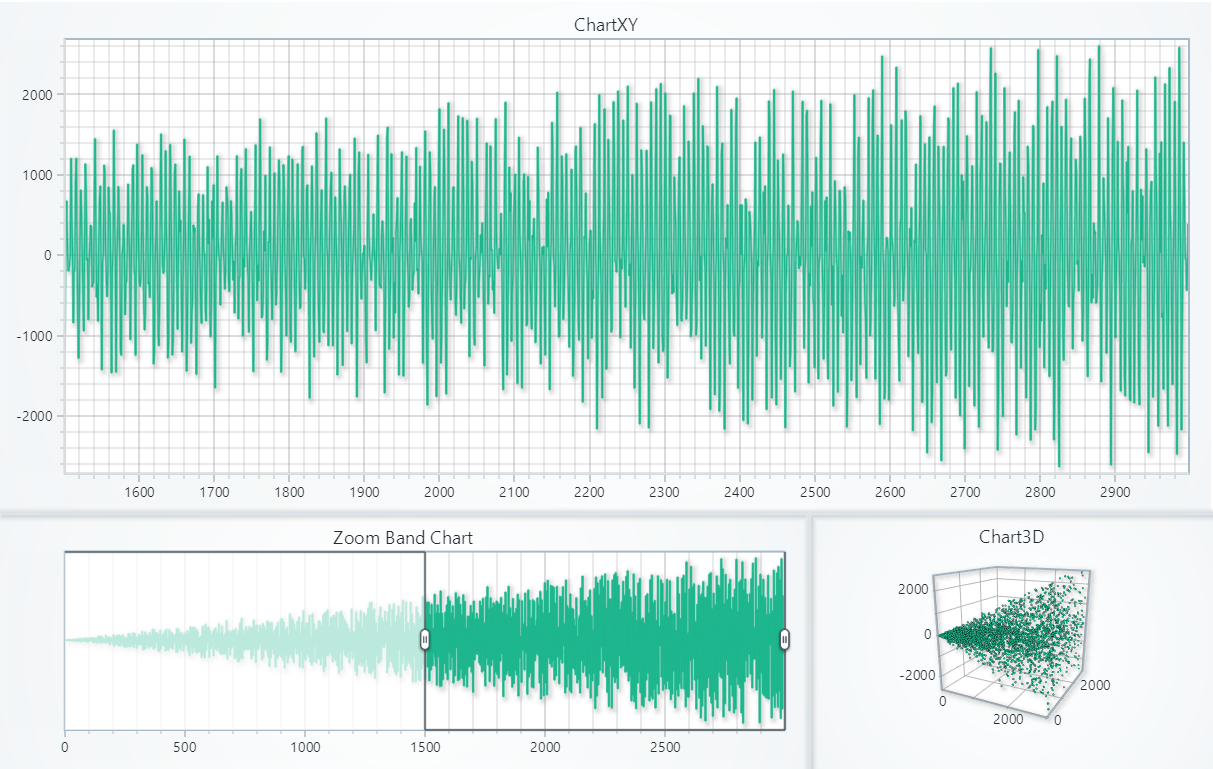
Dashboard with real-time data:
import lightningchart as lc
import random
import math

lc.set_license('my-license-key')

dashboard = lc.Dashboard(columns=3, rows=3, theme=lc.Themes.Light)

# ChartXY
chart1 = dashboard.ChartXY(column_index=0, row_index=0, column_span=3, row_span=2)
series1 = chart1.add_line_series(
    schema={
        'x': {'pattern': 'progressive'},
        'y': {'pattern': None}
    })
x_axis = chart1.get_default_x_axis()
x_axis.set_scroll_strategy(strategy='scrolling')
x_axis.set_interval(start=-500, end=0, stop_axis_after=False)

# ZoomBandChart for ChartXY
zbc = dashboard.ZoomBandChart(chart=chart1, column_index=0, row_index=2, column_span=2, row_span=1)
zbc.add_series(series1)

# Chart3D
chart2 = dashboard.Chart3D(column_index=2, row_index=2, column_span=1, row_span=1)
series2 = chart2.add_point_series()

dashboard.open(live=True)

# Generate random data and update charts
for i in range(3000):
    datapoint = {
        'x': i,
        'y': math.sin(i) * random.randint(0, i),
        'z': random.uniform(0, i)
    }
    series1.add_dict_data(datapoint)
    series2.add_dict_data(datapoint)

dashboard.close()
Zoom Band Chart
Zoom Band Chart is a Dashboard component, which can be linked to any amount of Series. It shows a compilation of all data from all Series that are attached to it, and allows the user to configure the view of the attached Axis easily by interacting with a Band on the Zoom Band Chart.
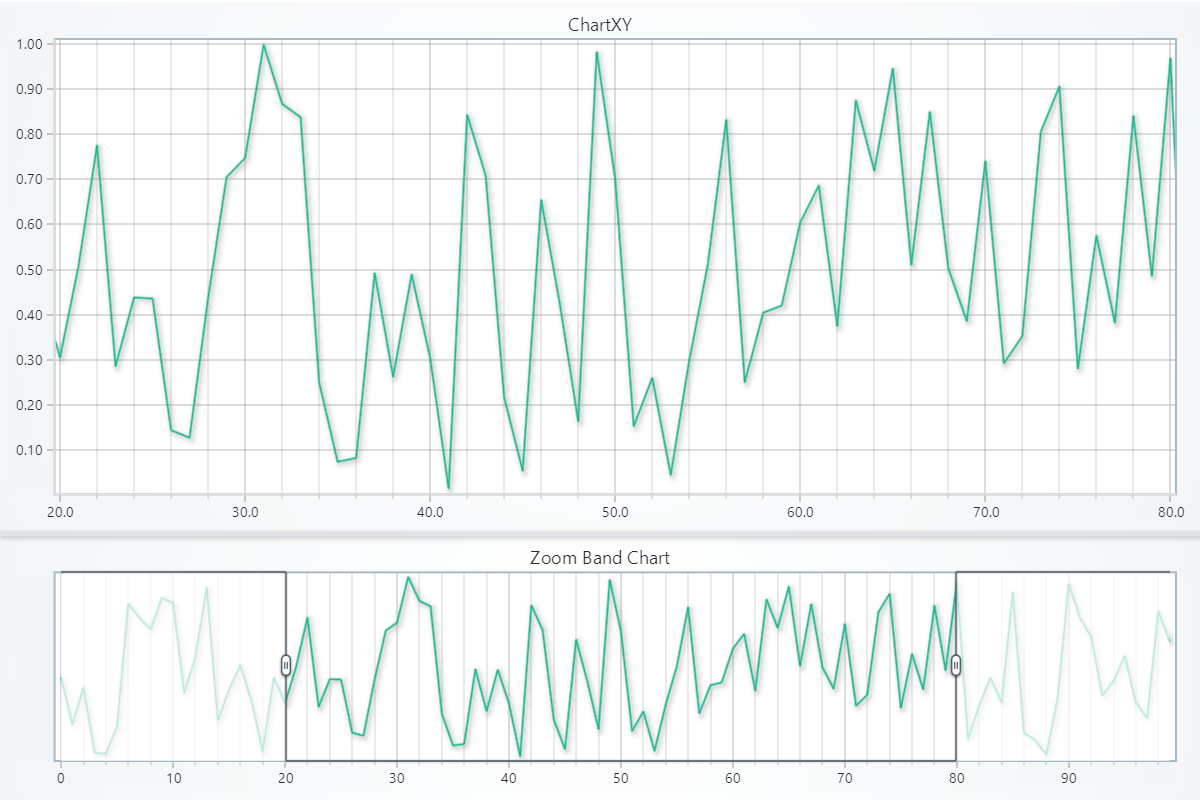
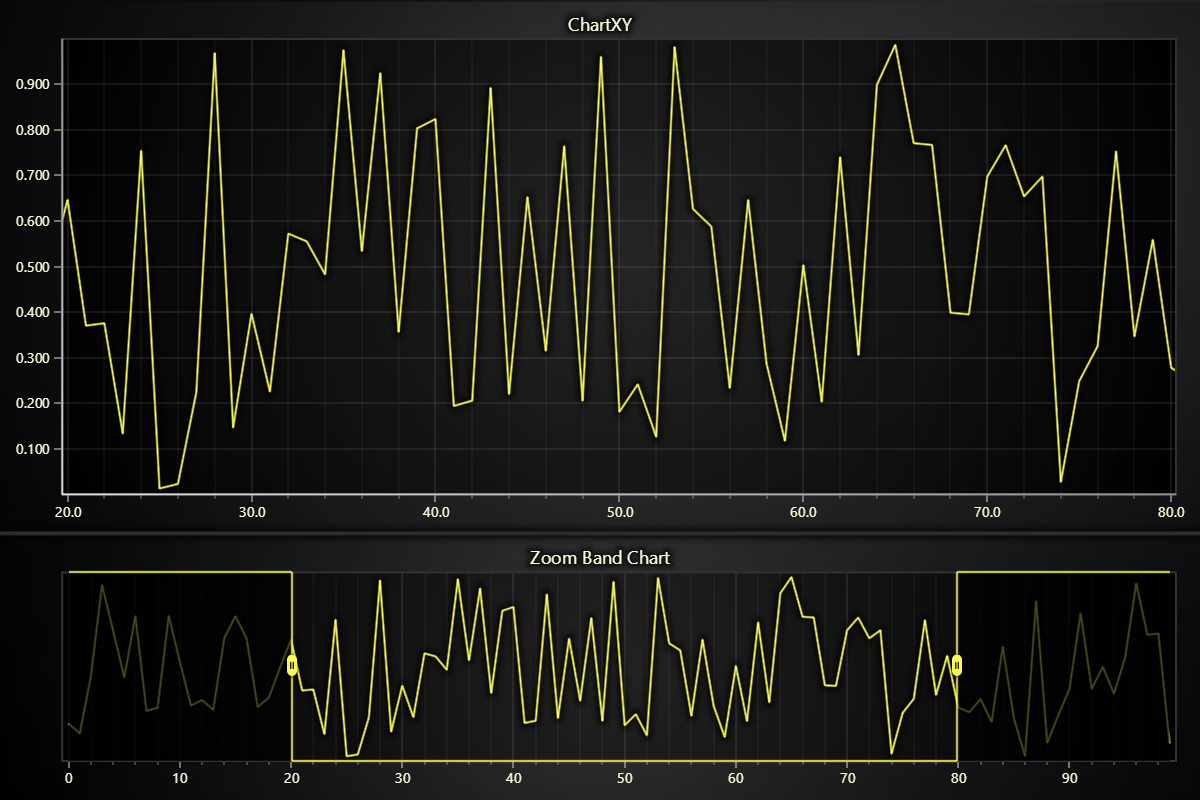
import lightningchart as lc
import random

lc.set_license('my-license-key')

# Create ChartXY within a Dashboard
dashboard = lc.Dashboard(columns=1, rows=3, theme=lc.Themes.Light)
chart_xy = dashboard.ChartXY(column_index=0, row_index=0, column_span=1, row_span=2)
x = list(range(0, 100))
y = [random.random() for _ in range(100)]
line_series = chart_xy.add_line_series().add(x, y)

# Create Zoom Band Chart that is attached to the ChartXY:
zbc = dashboard.ZoomBandChart(chart=chart_xy, column_index=0, row_index=2)
# Set the Zoom Band Chart to display the line series
zbc.add_series(line_series)

dashboard.open()
Coordinate Transformation
Convert between screen and chart-relative coordinates for positioning UI elements or handling mouse interactions in Dashboard and Zoom Band Chart.
# Client to relative (auto-detect)
relative = dashboard.translate_coordinate(
    {'clientX': 500, 'clientY': 300},
    target='relative'
)

# Relative to client
client = zbc.translate_coordinate(
    {'x': 400, 'y': 250},
    target='client',
    source='relative'
)
- relative: Pixels from chart edges
- client: Browser viewport pixels