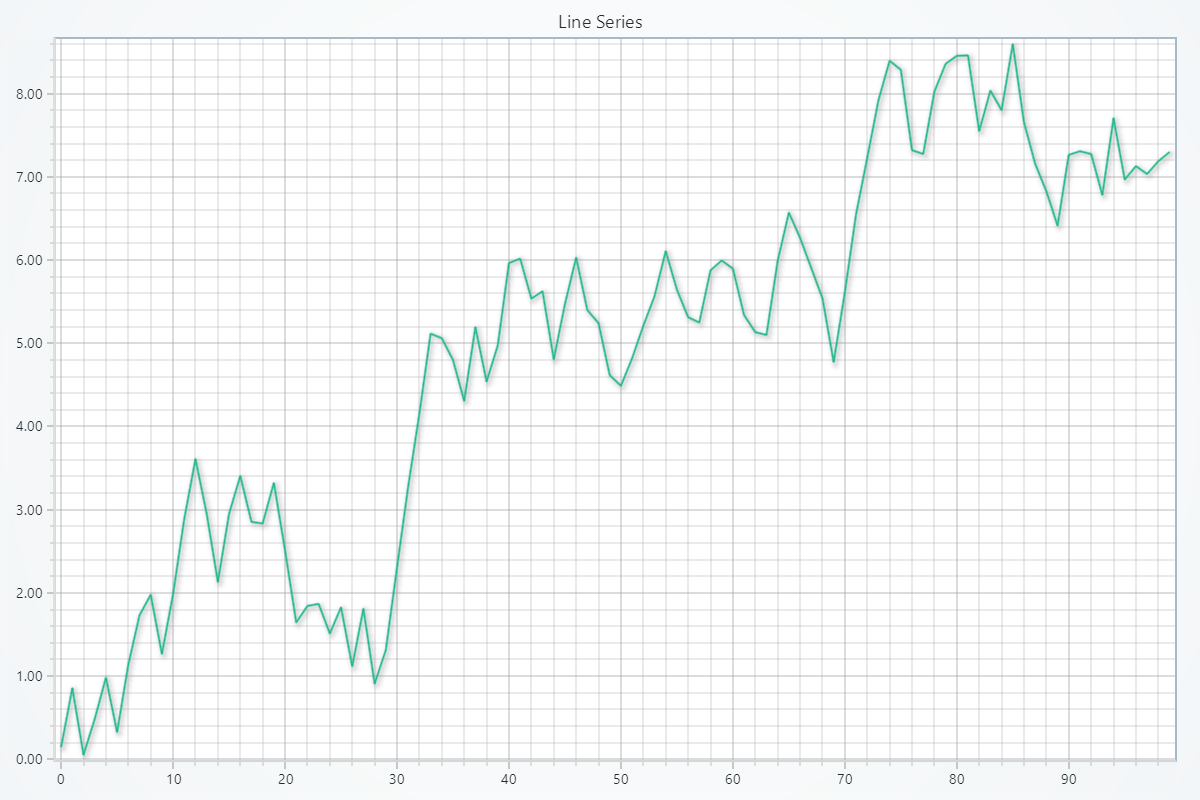
Line Series
Series type for visualizing a list of points (pair of X and Y coordinates), with a continuous stroke.
Creating Line Series
series = chart.add_line_series()
Adding Data
There are many different ways you can add data to a Line series. The most basic way is to specify two lists of numbers, one for X coordinates, and another for Y coordinates.
# Using x and y lists:
x_values = [0, 1, 2, 3]
y_values = [1, 3, 2, 4]
series.add(x_values, y_values)
Please refer to Adding Data to Charts section to see other available ways of adding data to a series.
Schema and Data Mapping
Both schema and data mapping concepts are technically optional (as in you can ignore them, supply data to series and most of the time it will work). However, depending on the use case you may need to understand what they are and how to configure them.
Schema
Schema defines what data can be stored in a series or data set:
series = chart.add_line_series(schema={
    'index': {'auto': True},
    'x': {'pattern': 'progressive'},
    'y': {'storage': 'Float32Array'},
    'pointSize': {}
})
If schema is not defined, it is automatically configured to match first incoming data. First pushed data can also expand the configured schema - meaning you can configure known data properties, and still be able to consume other data properties that you may not know beforehand.
Data Mapping
Data mapping specifies how data properties of the schema should be used:
series.set_data_mapping({'x': 'index', 'y': 'y', 'size': 'pointSize'})
Series and data sets can contain any number of different data properties. The above example says: "use 'index' as X, 'y' as Y and 'pointSize' as size of points".
If data mapping is not defined, it is automatically configured by looking at what is available and what are the names of data properties. While this works most of the time, explicit data mapping configuration is recommended to not leave such a critical configuration up to chance. It must include at least x and y. Optionally also color, size, lookupValue and rotation can be specified.
Customizing Line Appearance
Changing Line Color
Using individual color:
import lightningchart as lc

series.set_line_color((255, 0, 0))
series.set_line_color('#FF0000')
series.set_line_color('red')
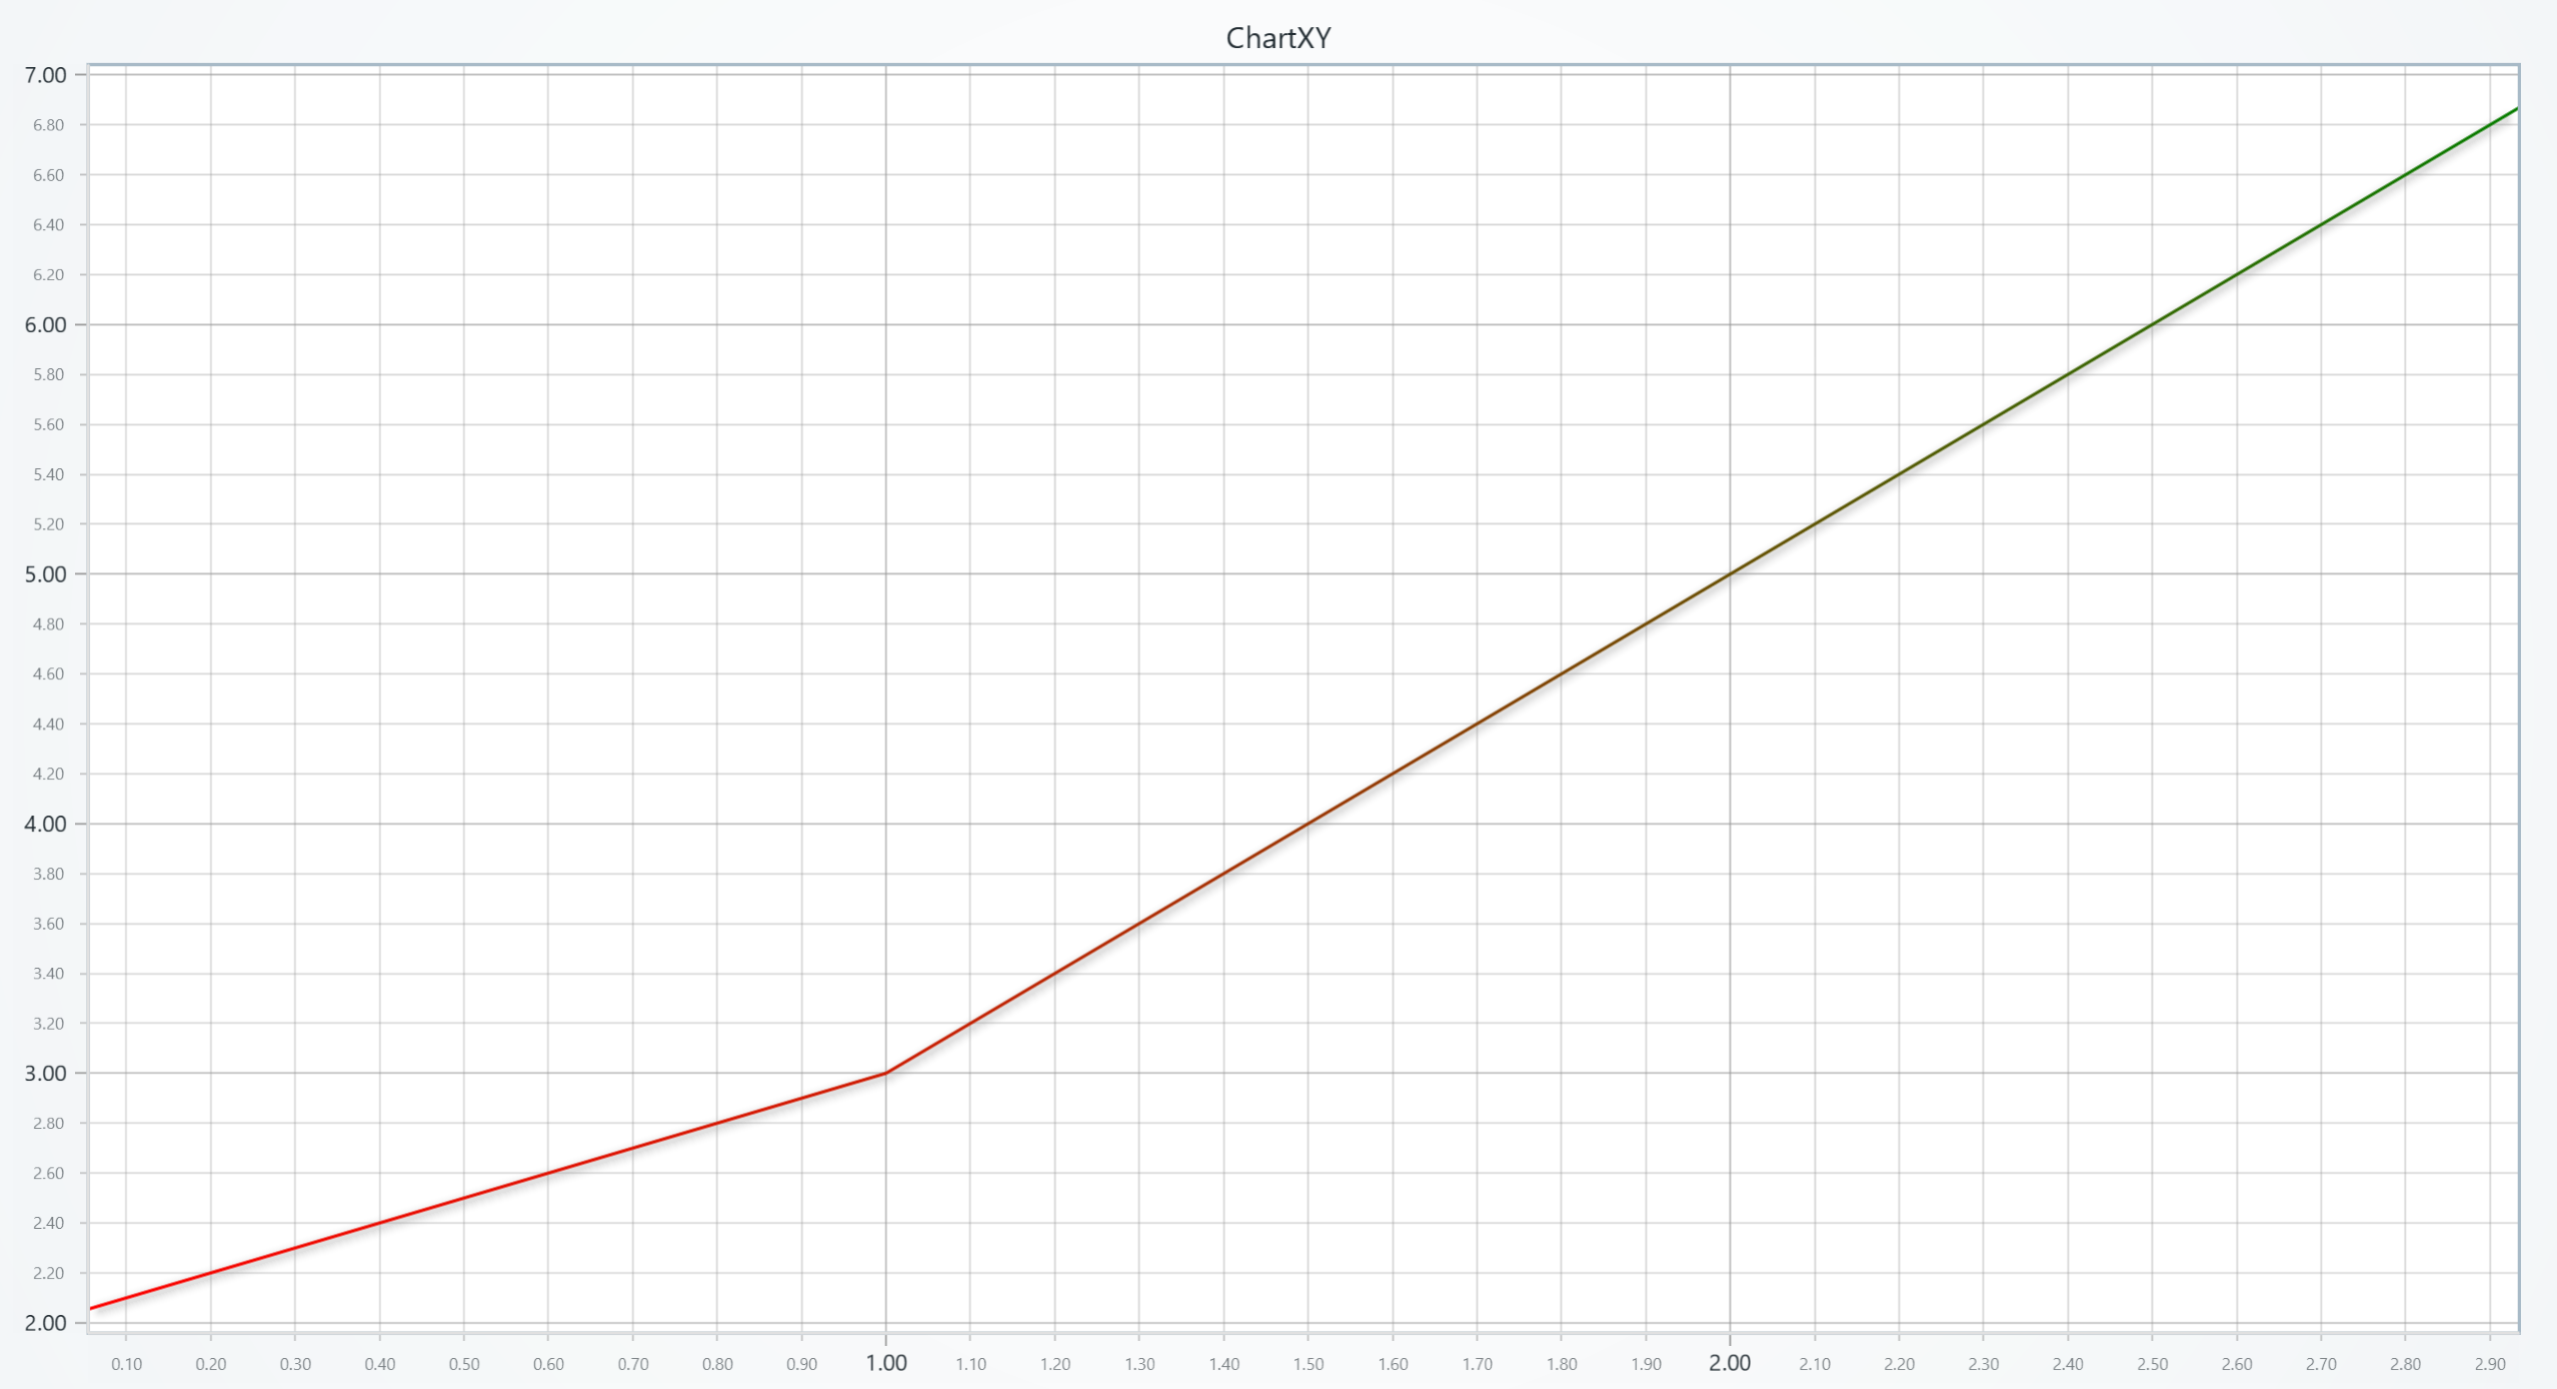
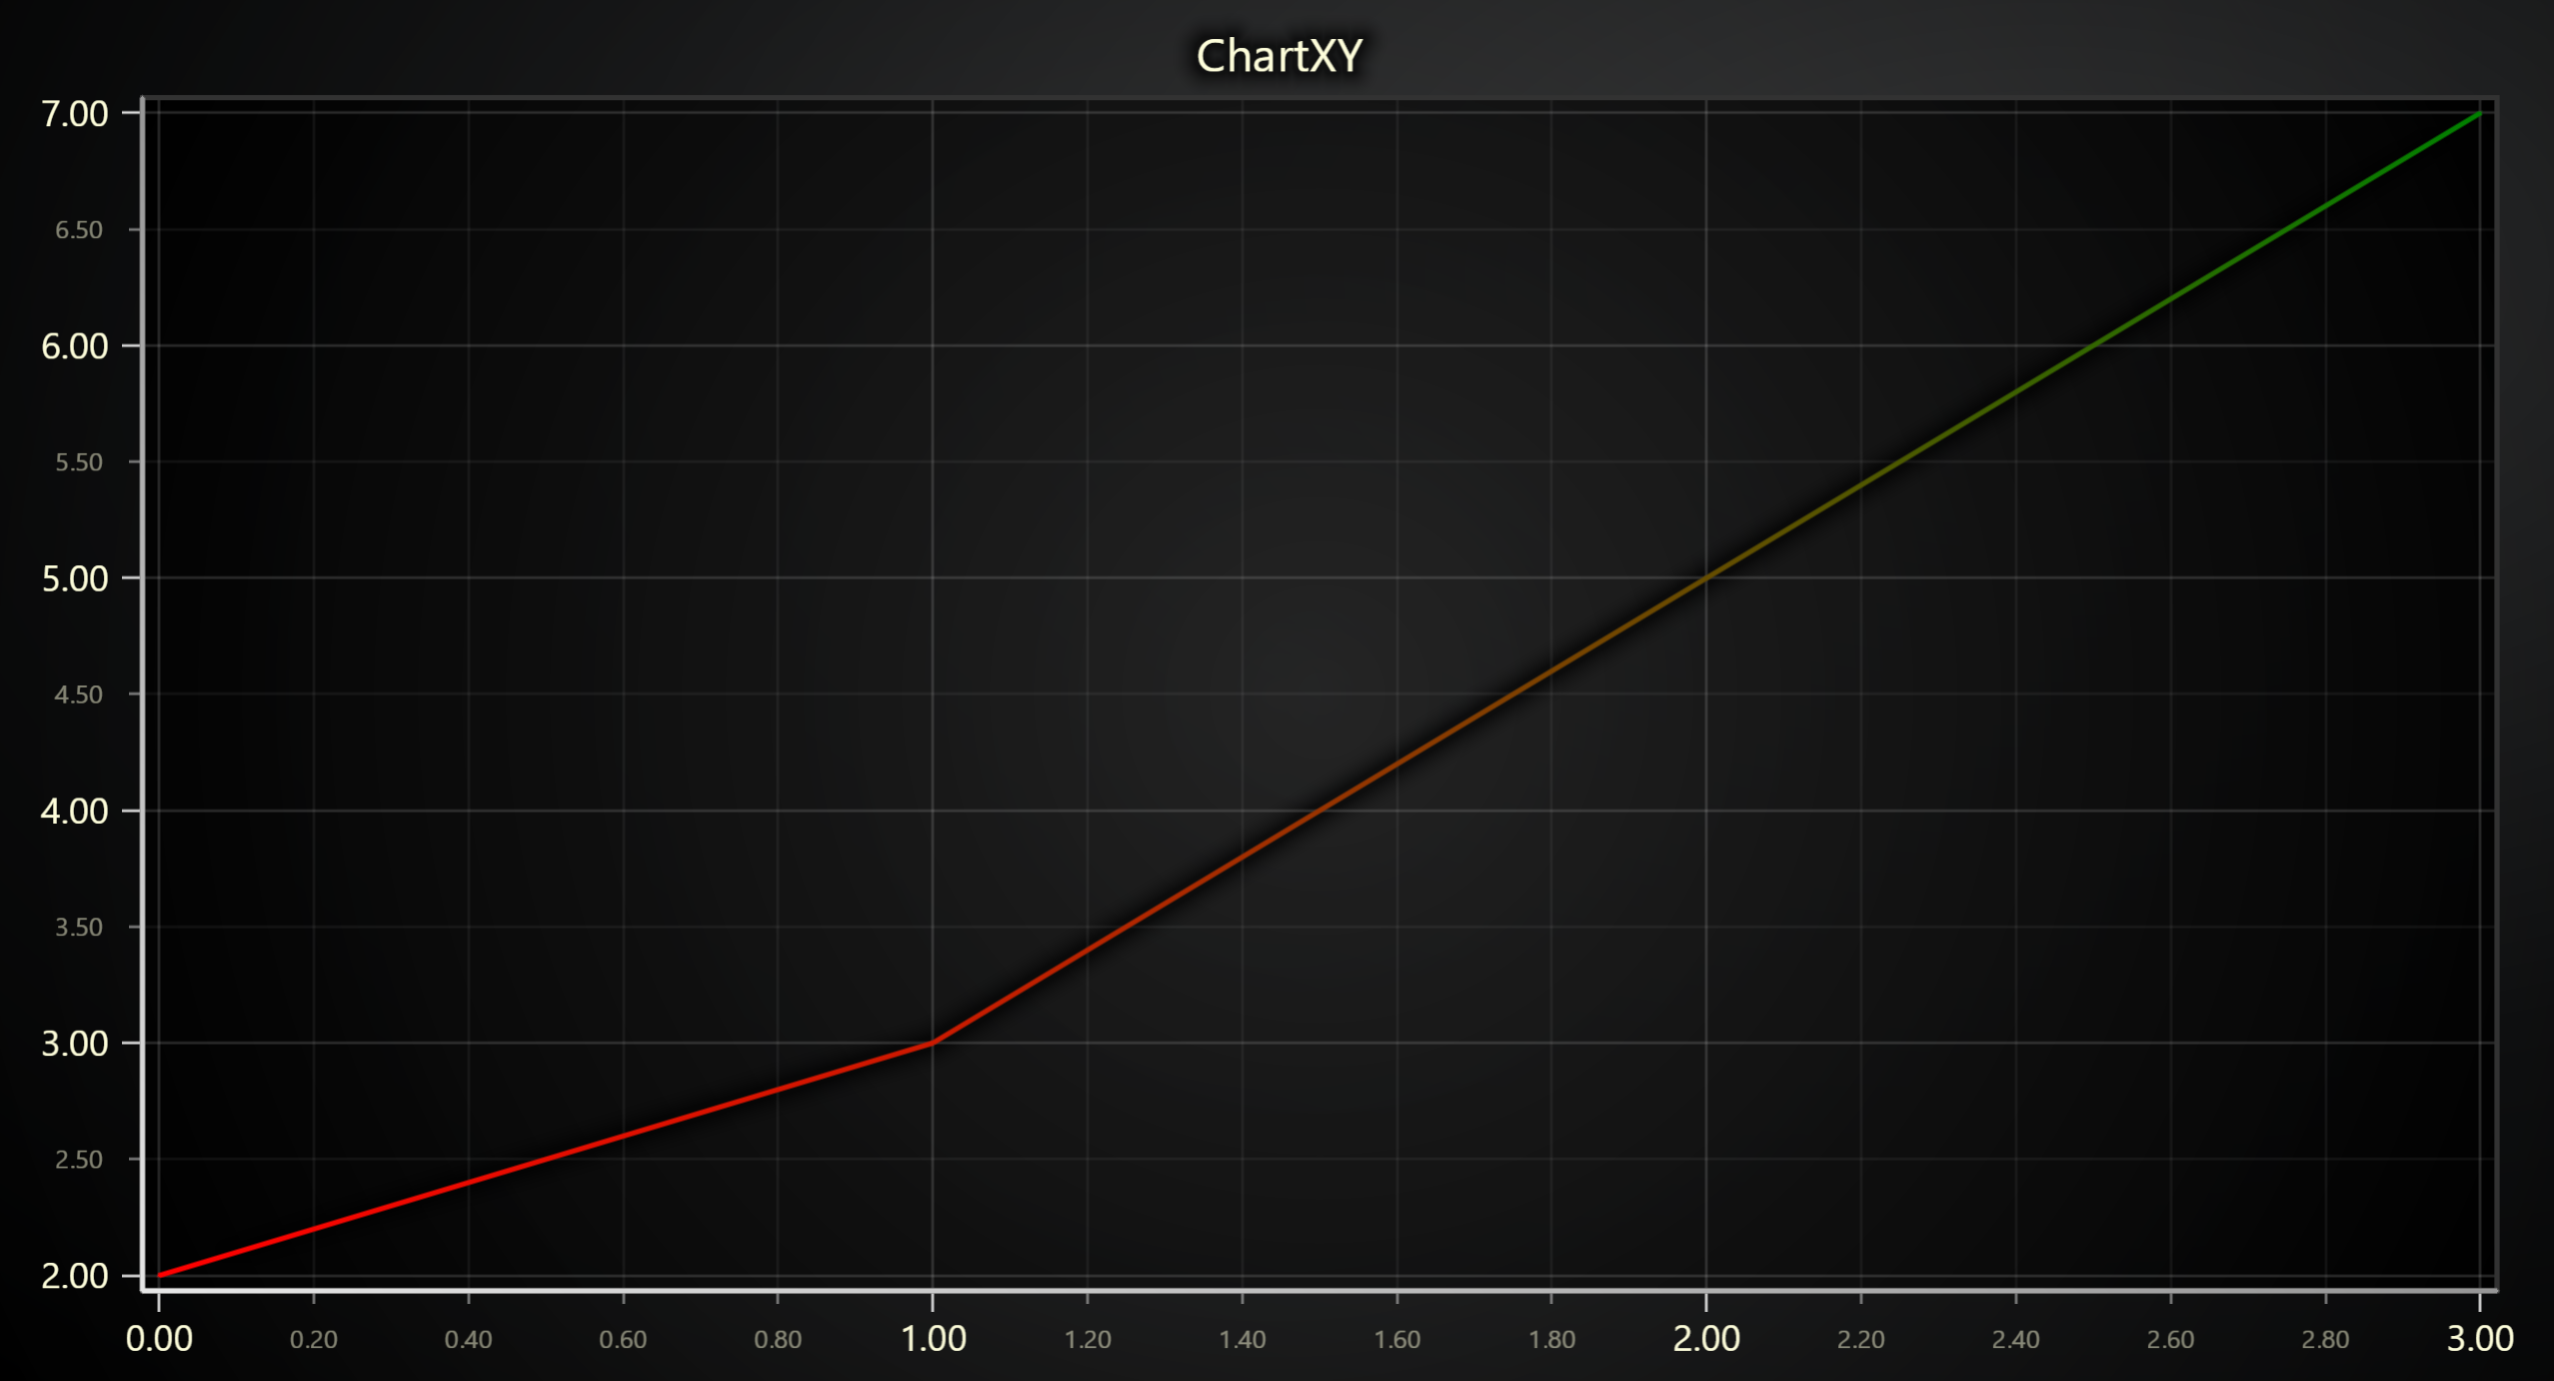
Using lookup table:
chart = lc.ChartXY(title='ChartXY', theme=lc.Themes.Light)
series = chart.add_line_series()


x_values = [0, 1, 2, 3]
y_values = [2, 3, 5, 7]
series.add(x_values, y_values)

# Define a palette for the line stroke to interpolate between red and green:
series.set_palette_line_coloring(
    steps=[
        {'value': 2, 'color': '#FF0000', 'label': 'Min'},
        {'value': 4, 'color': (255, 255, 0)},
        {'value': 7, 'color': 'green', 'label': 'Max'},
    ],
    look_up_property='y',
    interpolate=True,
)

# With formatted legend display:
series.set_palette_line_coloring(
    steps=[
        {'value': 0, 'color': '#0000FF'},
        {'value': 100, 'color': '#FF0000'},
    ],
    look_up_property='value',
    formatter_precision=2,           # Decimal places
    formatter_unit='mag',             # Unit suffix
    formatter_scale=1.5,              # Scale values
    formatter_type='scientific',      # 'standard', 'compact', 'engineering', 'scientific'
    formatter_operation='floor',      # 'none', 'round', 'ceil', 'floor'
)
Changing Line Thickness
series.set_line_thickness(5)
Changing Line Pattern
import lightningchart as lc

series.set_dashed(pattern="Dashed", thickness=3, color='#0000FF')
Available patterns include: "DashDotted", "Dashed", "DashedEqual", "DashedLoose", "Dotted", and "DottedDense".
Series Utility Methods
# Set a name for the series (used in legend and tooltip)
series.set_name("Team Alpha")

# Highlight the series fully (1.0 = max highlight)
series.set_highlight(1.0)

# Enable or disable whether this series participates in cursor pick events
series.set_cursor_enabled(False)

# Set the drawing order index (higher value is drawn on top)
series.set_draw_order(2)

# Enable or disable theme-based visual effects
series.set_effect(True)

# Toggle series visibility (False hides it from view)
series.set_visible(True)

# Clear all points from the series
series.clear()

# Permanently remove the series from the chart
series.dispose()

# Set whether element can be target of pointer events or not.
series.set_pointer_events(True)
Legend
Please see common legend section.