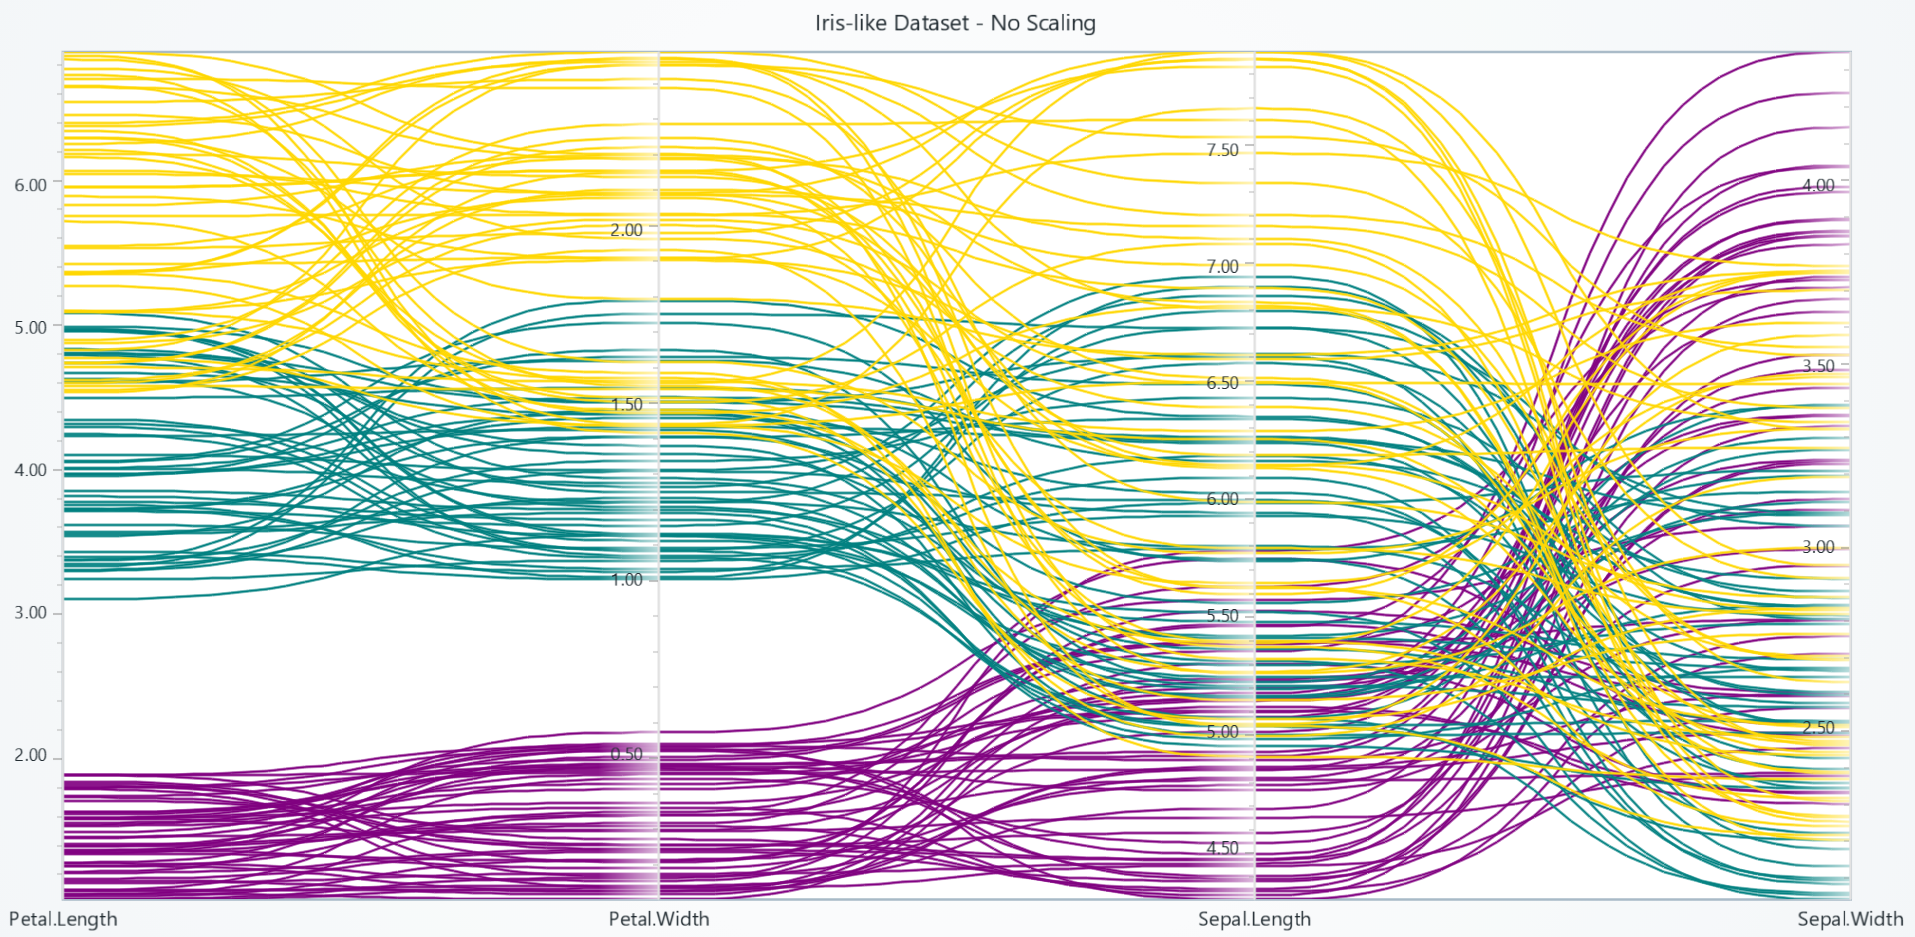
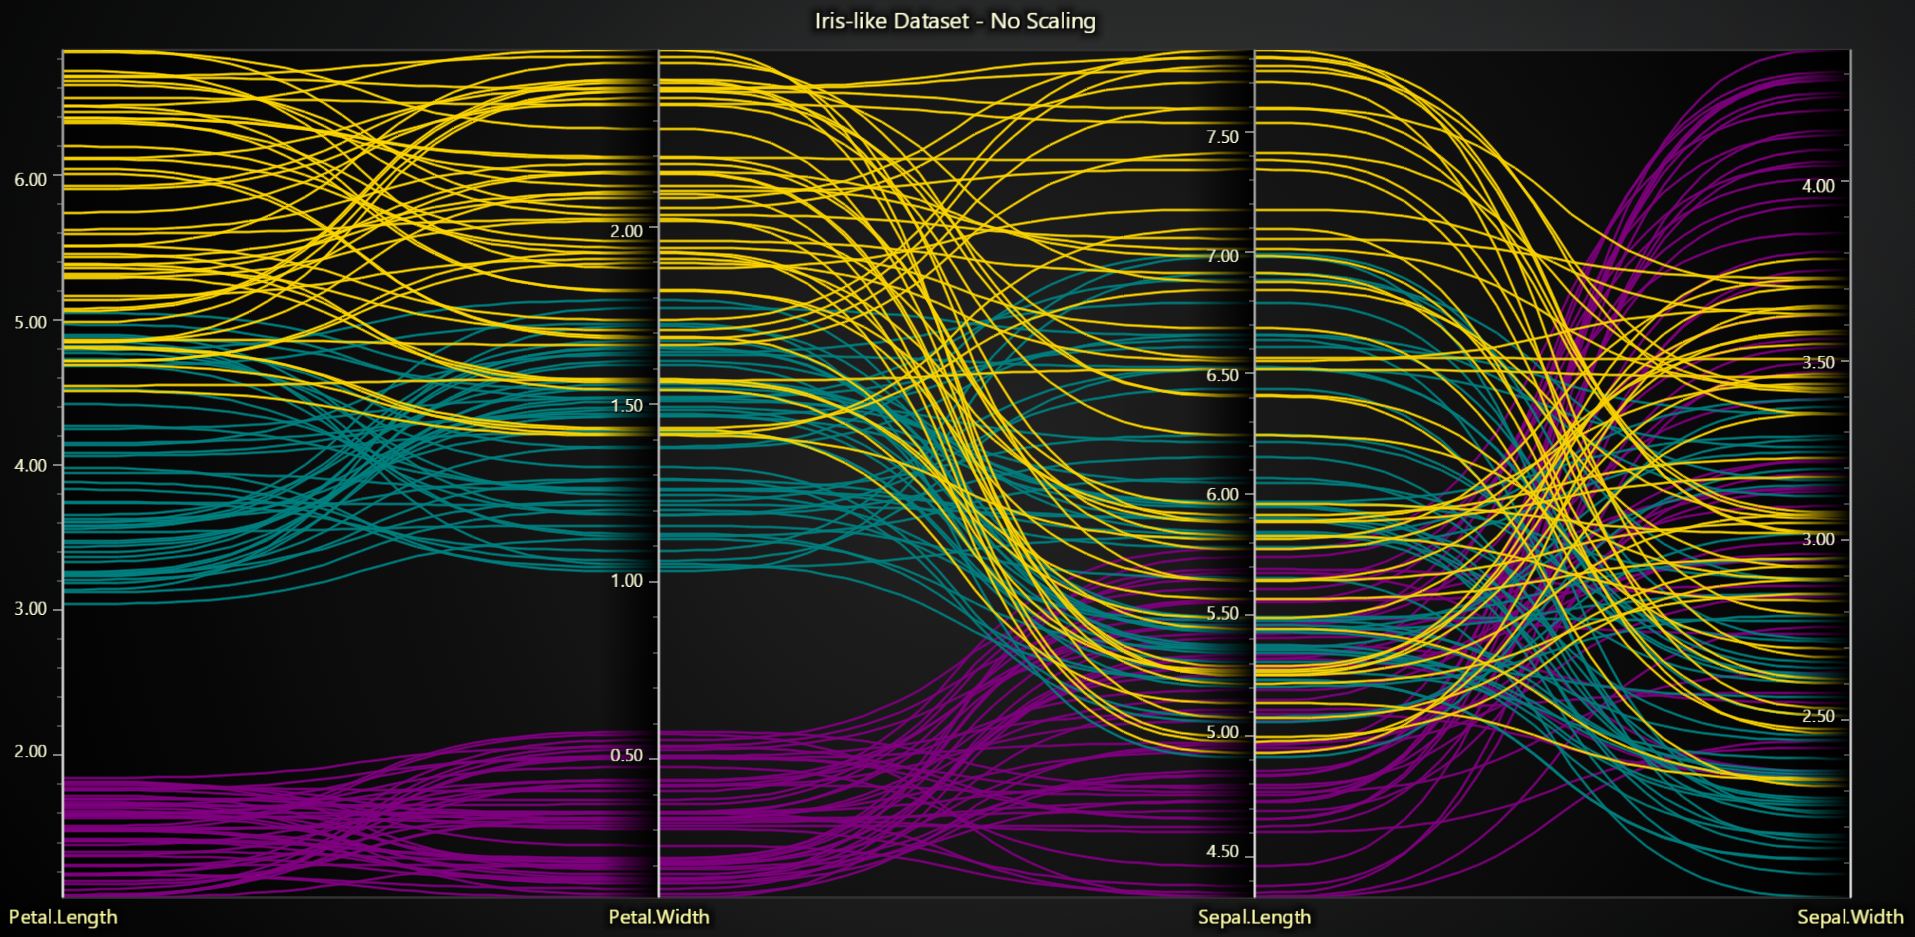
Parallel Coordinate Series
Series for visualizing multidimensional data across parallel axes and each data point is displayed as a series of connected points along the axes which are positioned parallel to each other.
Creating a Series
Use the chart's add_series method to create an empty Parallel Coordinate series:
# Assume `parallel_chart` is an instance of ParallelCoordinateChart
series = parallel_chart.add_series()
Managing Data
Setting Data
Define a set of axis-value pairs for this series. Keys must match the axes defined on the chart:
data_point = {
    'Temperature': 75.0,
    'Pressure':    1.25,
    'Yield':      50.0,
}
series.set_data(data_point)
Retrieving Data
Query the currently assigned values for inspection or further processing:
current = series.get_data()
print(current)  # {'Temperature': 75.0, 'Pressure': 1.25, 'Yield': 50.0}
Fill & Palette Styling
set_lut method could be used for dynamically coloring series based on their value along a specific Axis
chart.set_lut(
    axis_key='batch_size',
    interpolate=True,
    steps=[
        {'value': 0.0, 'color': '#FF0000'},
        {'value': 500.0, 'color': '#FFFF00'},
        {'value': 1000.0, 'color': '#00FF00'},
    ],
)

# Color lines based on their “Variable B” dimension using a LUT with formatting
chart.set_lut(
    axis_key="Variable B",
    interpolate=True,
    steps=[
        {'value': 80, 'color': ('red')},
        {'value': 100, 'color': ('yellow')},
        {'value': 112, 'color': ('green')},
    ],
    formatter_operation='ceil',
    formatter_precision=2,
    formatter_scale=2,
    formatter_unit='%',
    formatter_type='compact'
)
Solid Fill
Apply a uniform fill color across the entire series:
series.set_color('#3366FF') # solid blue background
Clearing Fill
Remove any fill, rendering the series transparent:
series.set_empty_color_fill()
Series Utility Methods:
# Set a name for the series (used in legend and tooltip)
series.set_name("Team Alpha")

# Highlight the series fully (1.0 = max highlight)
series.set_highlight(1.0)

# Enable or disable whether this series participates in cursor pick events
series.set_cursor_enabled(False)

# Enable or disable theme-based visual effects
series.set_effect(True)

# Toggle series visibility (False hides it from view)
series.set_visible(True)

# Permanently remove the series from the chart
series.dispose()