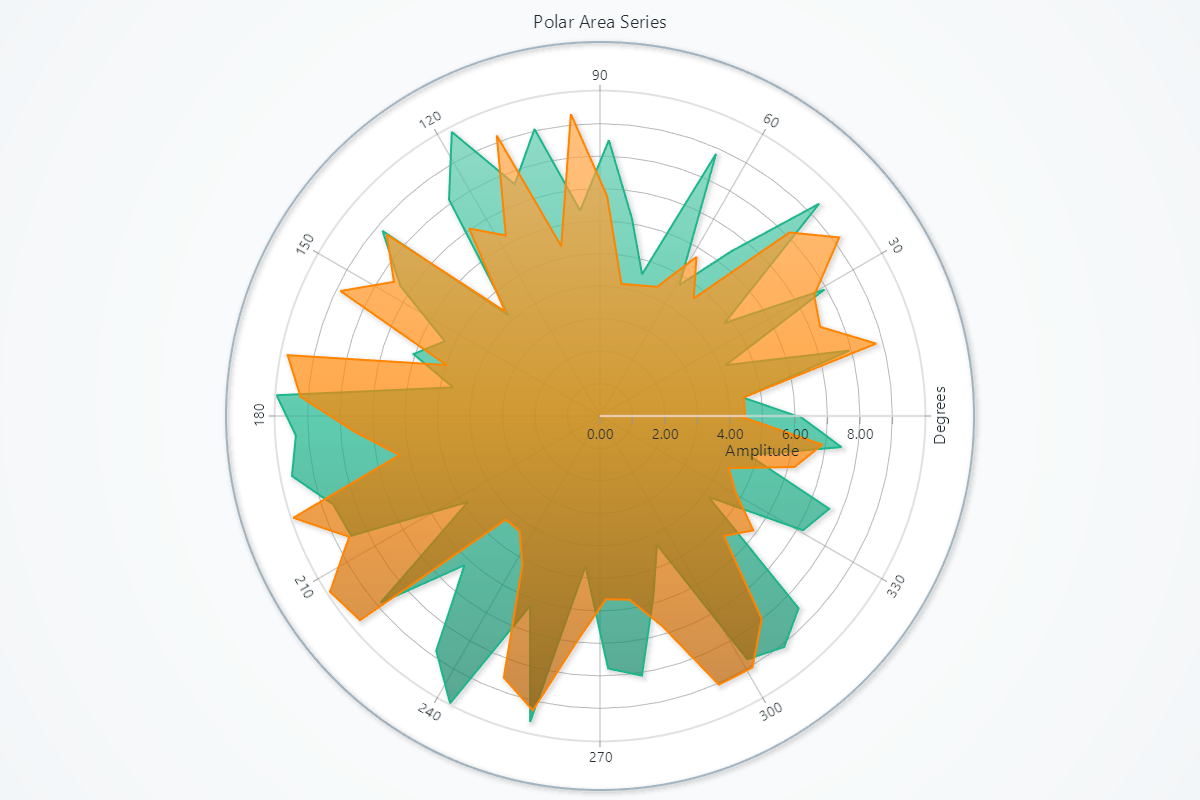
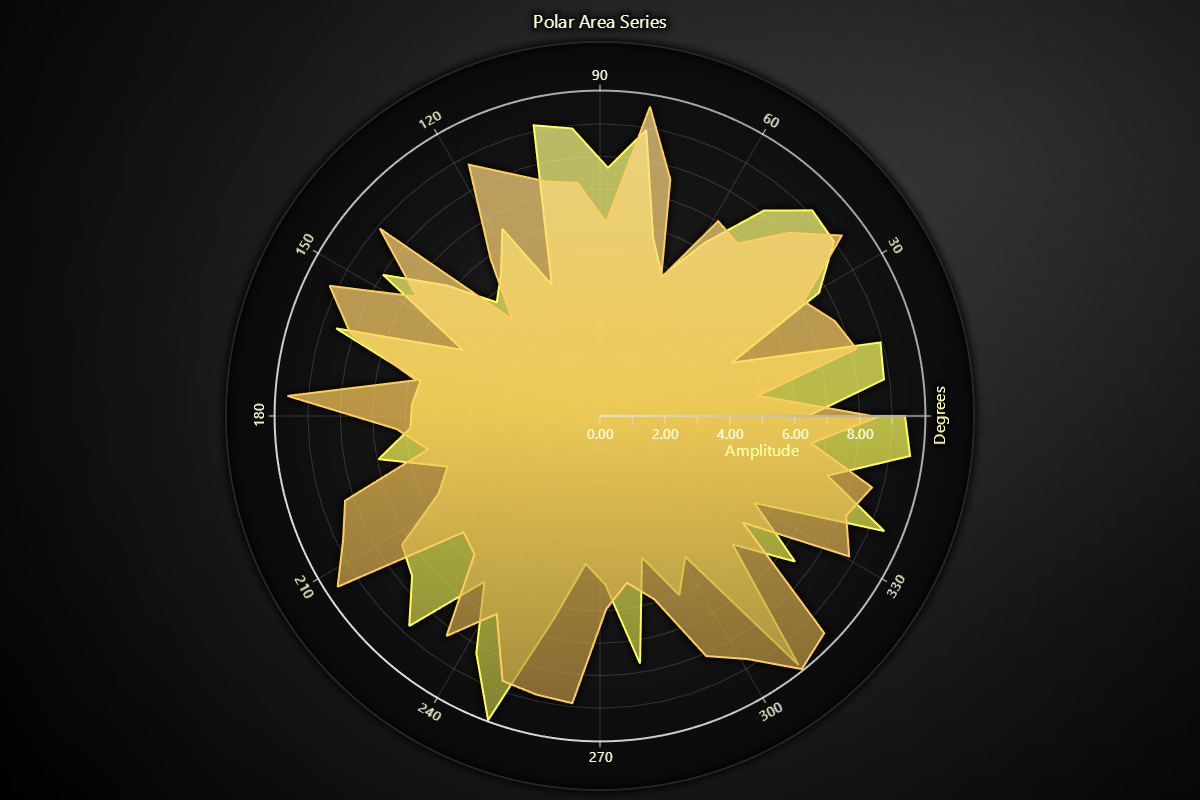
Polar Area
Series that fills the Polar area between data points and center of Polar Chart.
Creating Polar Area Series
series = chart.add_area_series()
Adding Data
Supply your series with angle/amplitude pairs:
# Overwrite all existing points:
series.set_data([
    {'angle':   0, 'amplitude':  1.0},
    {'angle':  45, 'amplitude':  2.5},
    {'angle': 135, 'amplitude':  1.8},
    {'angle': 270, 'amplitude':  0.5},
])
Fill Coloring
# Solid color fill:
series.set_color('#FF0000')

# Remove any fill style:
series.set_empty_color_fill()

# Per-value palette lookup:
series.set_palette_coloring(
    steps=[
        {'value':  0, 'color': '#ADD8E6'},
        {'value': 10, 'color': '#00008B'},
    ],
    look_up_property='value',
    interpolate=True,
    percentage_values=False,
)

# With formatted legend display:
series.set_palette_coloring(
    steps=[
        {'value': 0, 'color': '#0000FF'},
        {'value': 100, 'color': '#FF0000'},
    ],
    look_up_property='value',
    formatter_precision=2,           # Decimal places
    formatter_unit='mag',             # Unit suffix
    formatter_scale=1.5,              # Scale values
    formatter_type='scientific',      # 'standard', 'compact', 'engineering', 'scientific'
    formatter_operation='floor',      # 'none', 'round', 'ceil', 'floor'
)
Stroke Styling
Changing stroke color and thickness:
# Stroke width and color
series.set_stroke(thickness=1.5, color='#333333')
Connectivity
# Disable closing the loop
series.set_connect_data_automatically_enabled(False)
Series Utility Methods
This section works the same as for Line, to avoid duplication of guides, please refer to the section under Line
Legend
Please see common legend section.