Polar Heatmap
Series for visualizing a Polar Heatmap with a static sector and annuli count. Has API for fast modification of cell values.
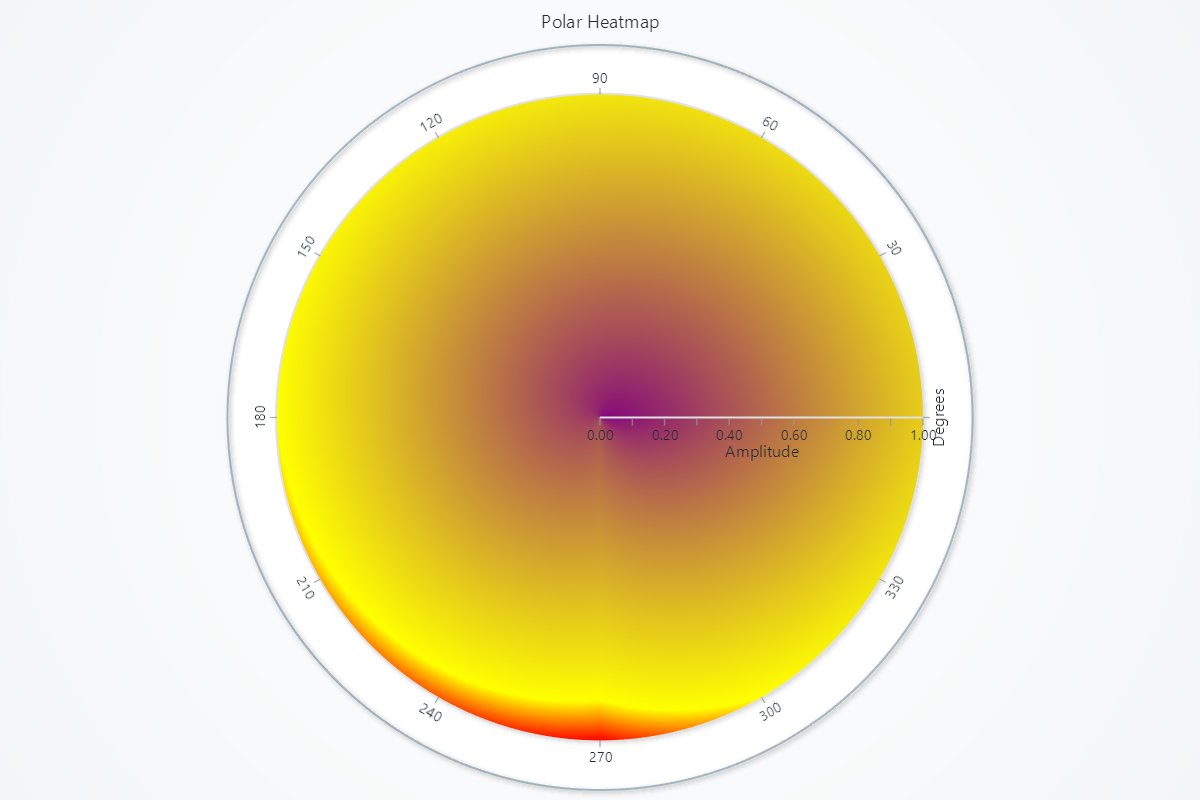
Creating Polar Heatmap Series
series = chart.add_heatmap_series(sectors=4, annuli=3)
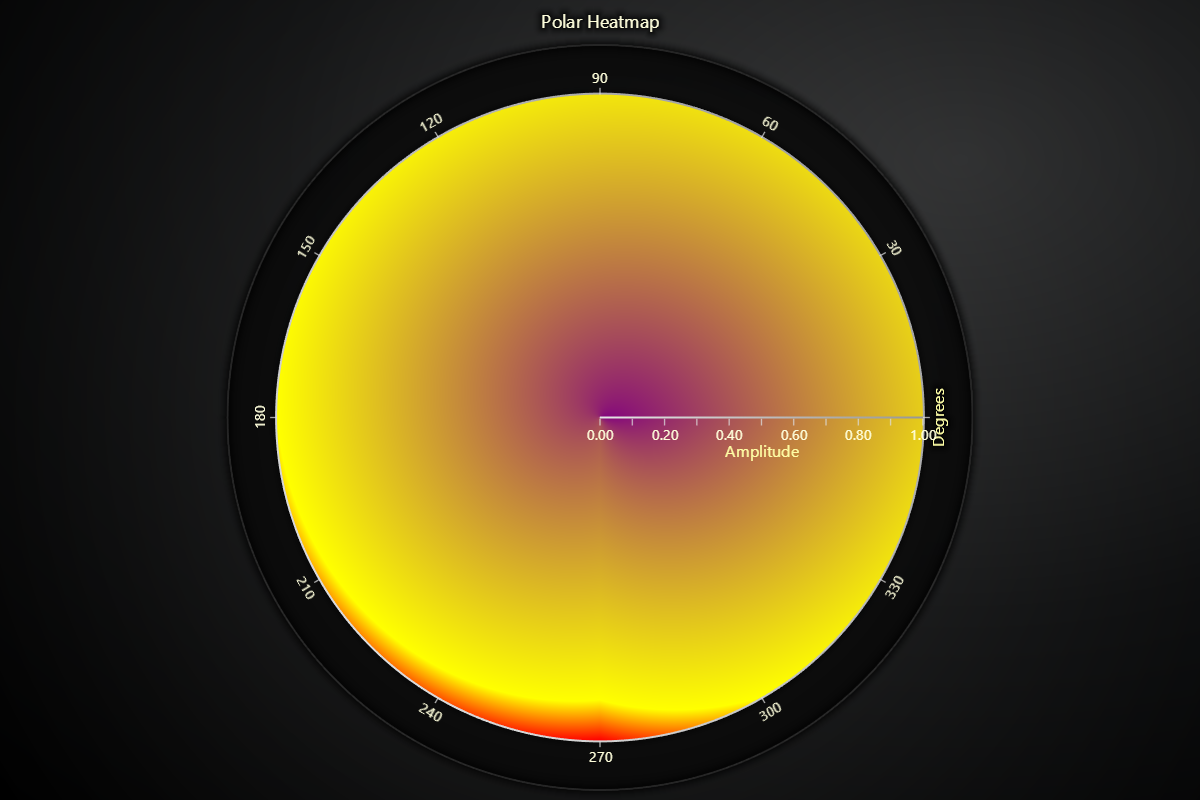
Intensity interpolation
# Enable smooth intensity interpolation:
series.set_intensity_interpolation(True)
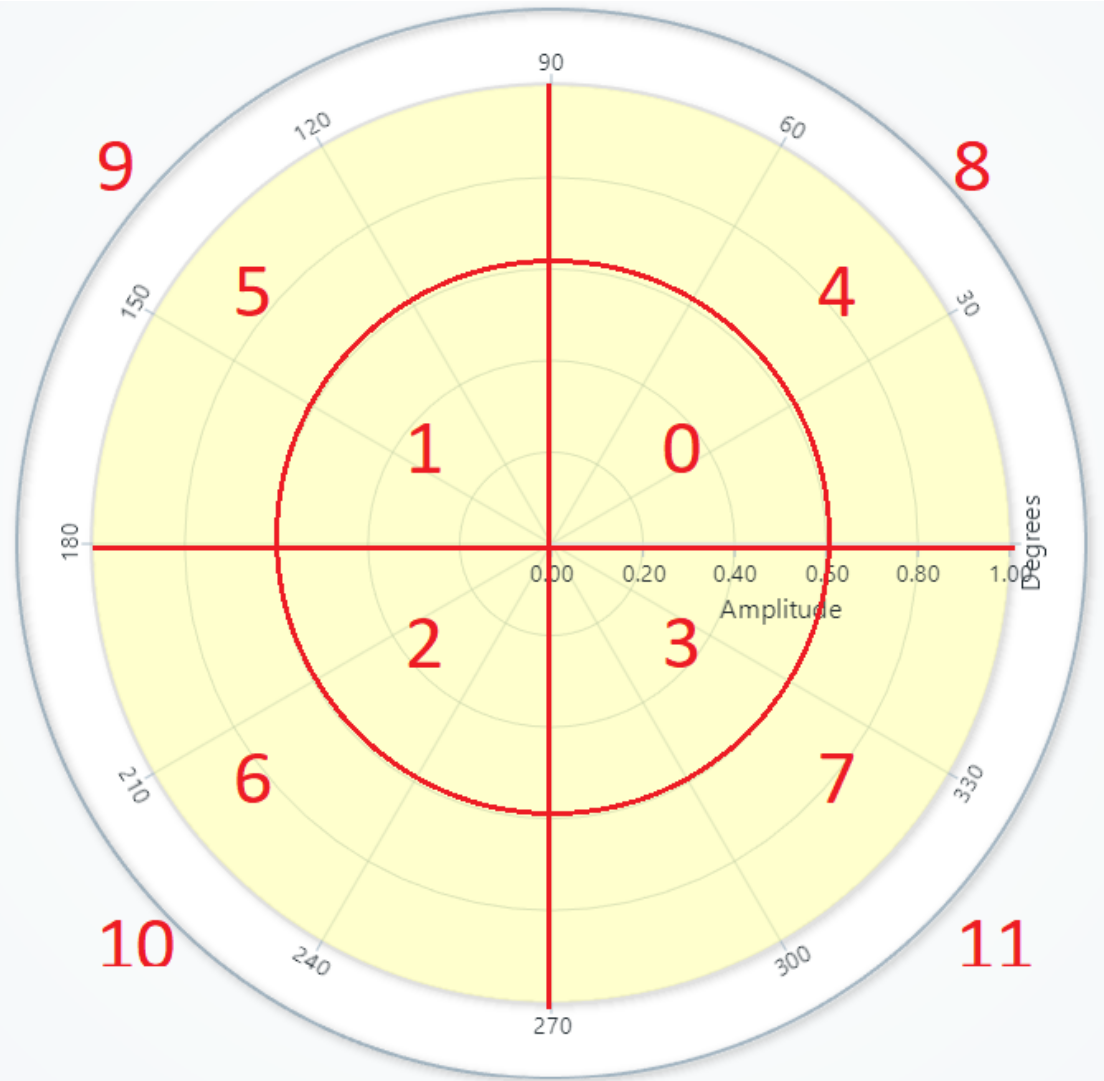
Invalidate Values
Polar heatmap series also supports modifying only a subset of the entire data array. Heatmaps consume data as uniform number matrixes. You can imagine this as a table of numbers:
# Update a block of cells starting at annulus 1, sector 2:
values = [
    [0, 1, 2, 3],
    [4, 5, 6, 7],
    [8, 9, 10, 11],
]
series.invalidate_intensity_values(
    values=values,
    i_annulus=1,
    i_sector=2
)
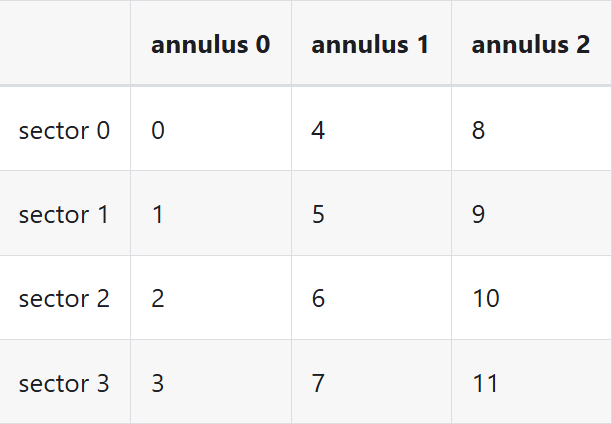
"uniform" means that the amplitude and radial step between each measurement is always the same.
Fill Coloring
# Solid color fill:
series.set_color('#FF0000')
# Remove any fill style:
series.set_empty_color_fill()
values = [
[0, 2.5, 5.0, 7.5],
[1, 3.5, 6.0, 8.5],
[2, 4.5, 7.0, 10.0],
]
series.invalidate_intensity_values(values)
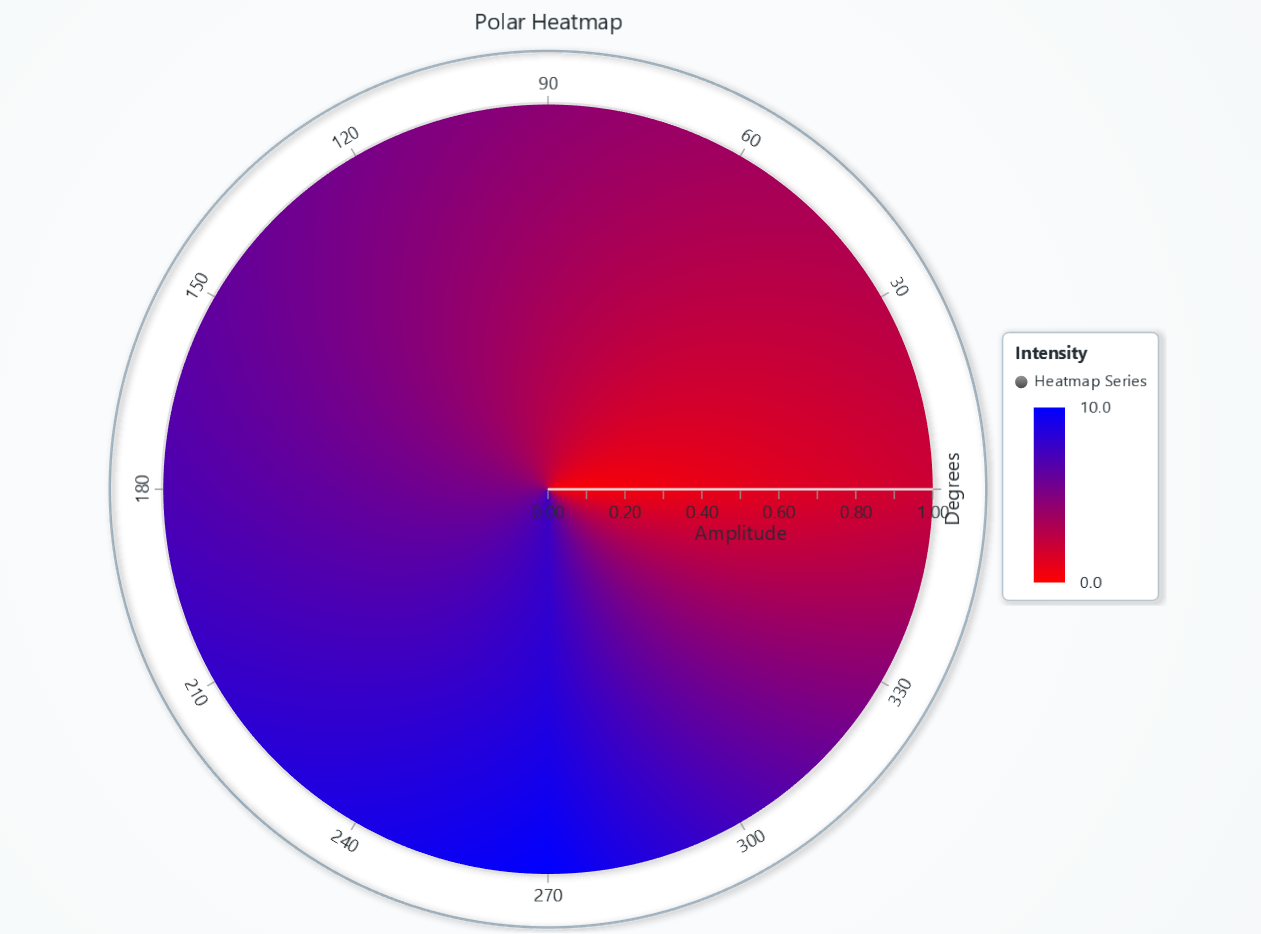
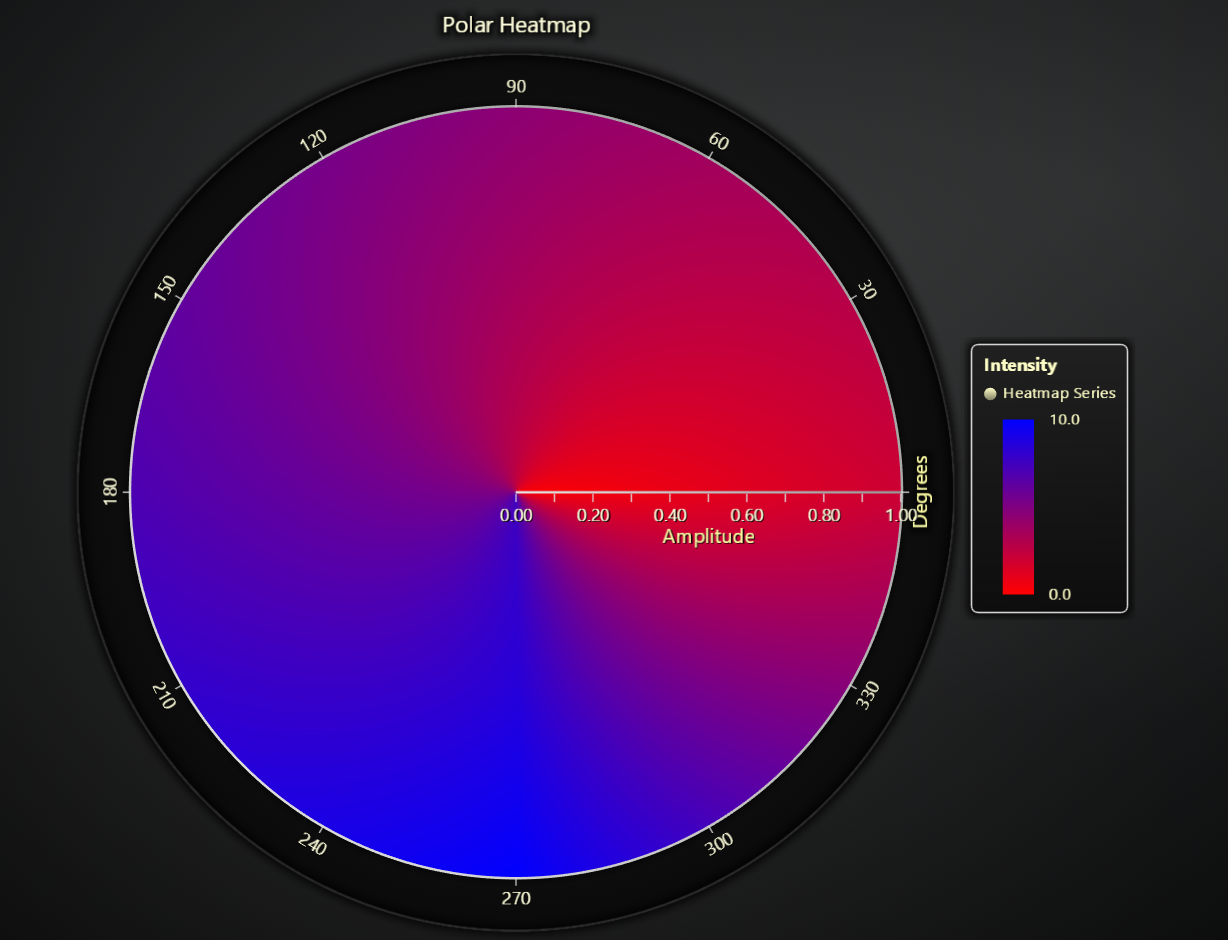
# Define a red→blue LUT (lookup table) for the fill
series.set_palette_coloring(
steps=[
{'value': 0, 'color': 'red'},
{'value': 10, 'color': 'blue'},
],
look_up_property='value',
interpolate=True,
)
# With formatted legend display:
series.set_palette_coloring(
steps=[
{'value': 0, 'color': '#0000FF'},
{'value': 100, 'color': '#FF0000'},
],
look_up_property='value',
formatter_precision=2, # Decimal places
formatter_unit='mag', # Unit suffix
formatter_scale=1.5, # Scale values
formatter_type='scientific', # 'standard', 'compact', 'engineering', 'scientific'
formatter_operation='floor', # 'none', 'round', 'ceil', 'floor'
)
Series Utility Methods
# Enable or disable theme-based effects on hover, etc.
series.set_effect(True)

# Include this series when axes auto-scroll or auto-fit:
series.set_auto_scrolling_enabled(True)

# Highlight sector under pointer on hover:
series.set_highlight_on_hover(True)
Legend
Please see common legend section.