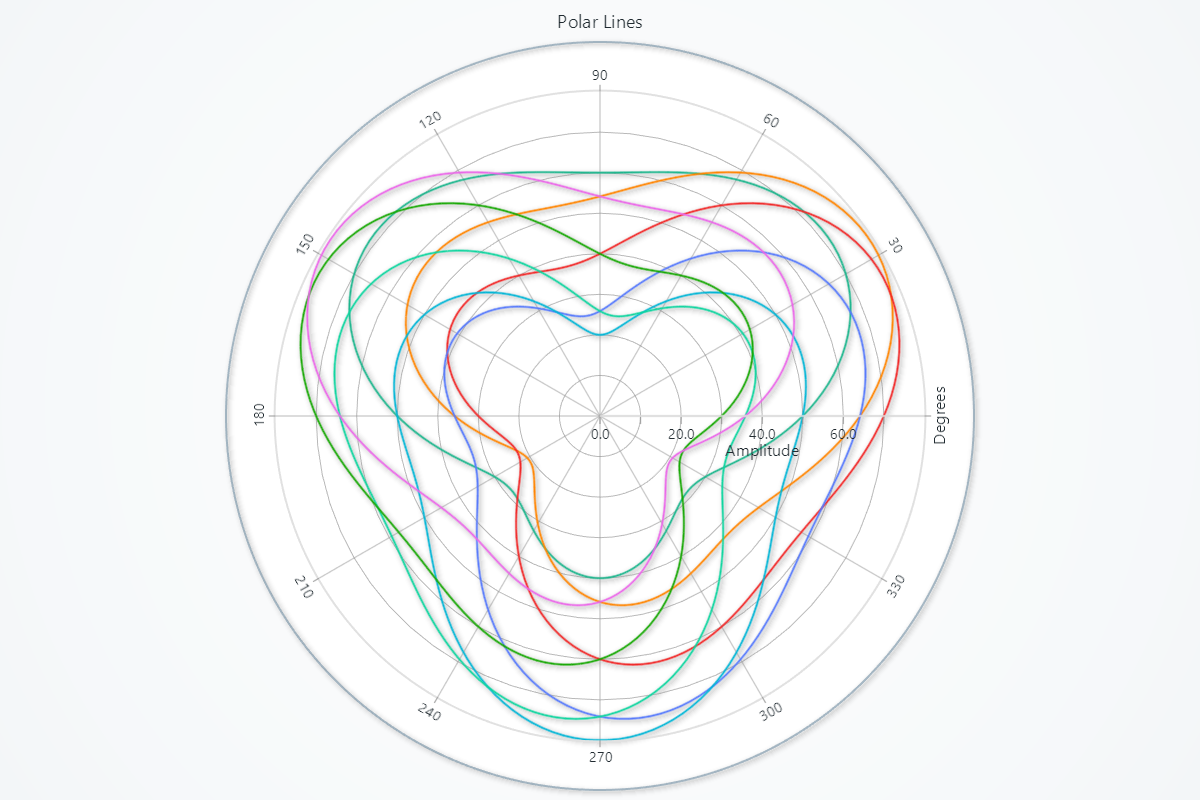
Polar lines
Polar Chart has two types of series for drawing lines:
Line Series
Type of PolarSeries for visualizing a collection of PolarPoints by connecting them with a line.
Creating Polar Line Series
series = chart.add_line_series()
Adding Data
Supply your series with angle/amplitude pairs:
# Overwrite all existing points:
series.set_data([
    {'angle':   0, 'amplitude':  1.0},
    {'angle':  45, 'amplitude':  2.5},
    {'angle': 135, 'amplitude':  1.8},
    {'angle': 270, 'amplitude':  0.5},
])
Line Appearance
Control the look of your polar line stroke:
# Solid line color:
series.set_line_color('#FF0000')

# Line thickness (pixels):
series.set_line_thickness(3)

# Dashed patterns:
series.set_dashed(pattern='Dashed',        # e.g. "DashDotted" | "Dashed" | "Dotted" …
                  thickness=2,             # optional override of thickness
                  color='#00AAFF')         # optional override of color
Stroke Styling
Changing stroke color and thickness:
# Stroke width and color
series.set_stroke(thickness=1.5, color='#333333')
Series Utility Methods
# Set a name for the series (used in legend and tooltip)
series.set_name("Series")

# Highlight the series fully (1.0 = max highlight)
series.set_highlight(1.0)

# Enable or disable whether this series participates in cursor pick events
series.set_cursor_enabled(False)

# Enable or disable theme-based visual effects
series.set_effect(True)

# Toggle series visibility (False hides it from view)
series.set_visible(True)

# Permanently remove the series from the chart
series.dispose()
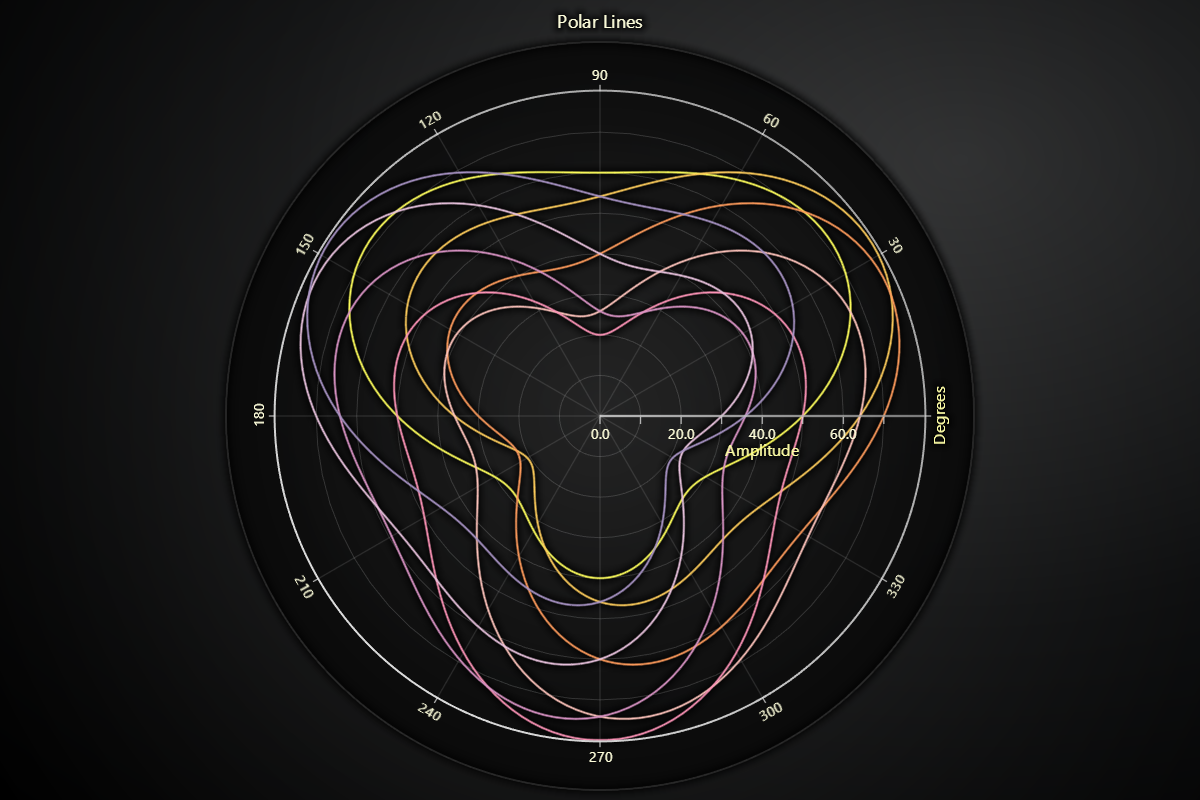
Point Line Series
Series for visualizing a collection of polar points by filling them with a specifiable point shape, as well as connecting them with a line.
Creating Polar Point Line Series
series = chart.add_point_line_series()
Enabling Individual Point Coloring
Enable per-point coloring (needed if you supply 'color' in your data dicts):
series.enable_individual_point_colors()
Point Styling
Control individual point shapes, sizes and colors.
# Set a common shape for all markers:
series.set_point_shape('diamond')   # arrow | circle | cross | diamond | minus | plus | square | star | triangle

# Override all point colors with a single fill color:
series.set_point_color('#FF8800')   # any CSS color

# Uniform size (pixels) for all point markers:
series.set_point_size(8)

# Rotate all point markers by an angle (degrees):
series.set_point_rotation(45)
Other point line series functions are exactly the same as Line series. To avoid duplication of guides, please refer to the section under Line
Legend
Please see common legend section.