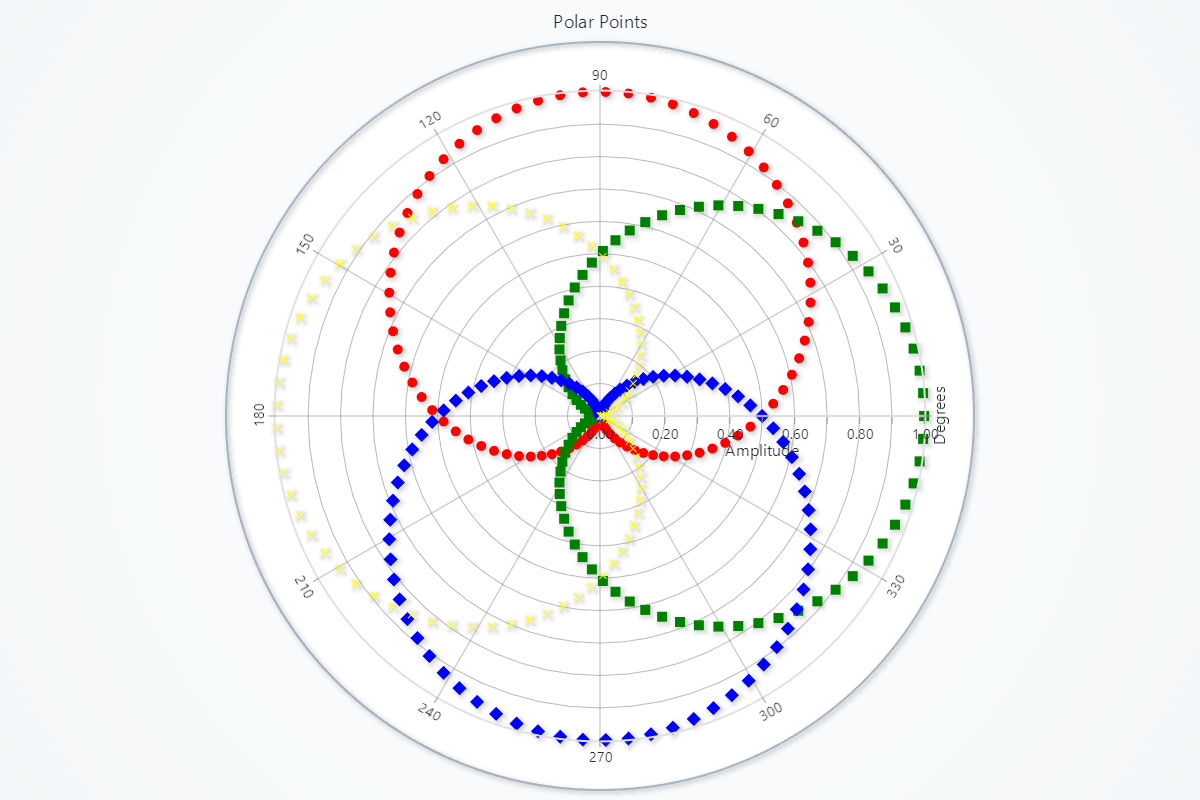
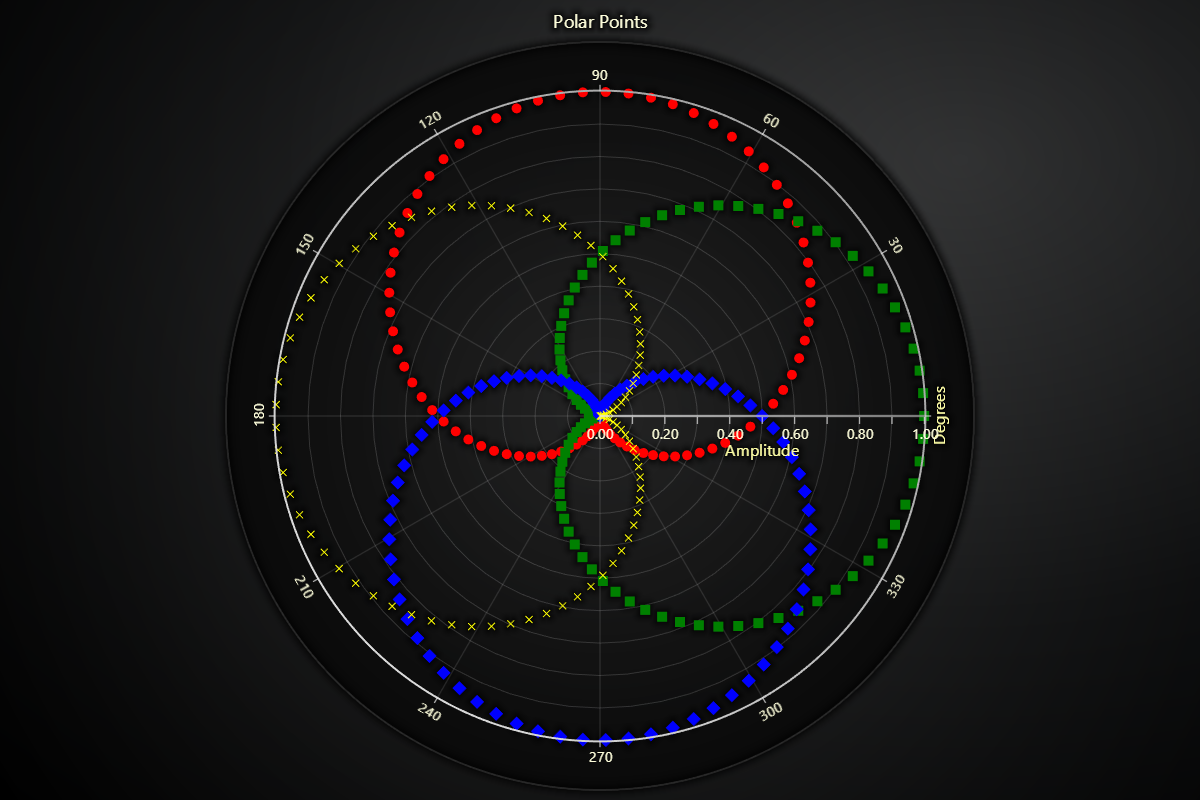
Polar Scatter Points
Polar Point Series is meant for visualizing a collection of polar points by filling them with a specifiable point shape.
Creating Polar Point Series
series = chart.add_point_series()
Adding Data
Supply your series with angle/amplitude pairs:
# Overwrite all existing points:
series.set_data([
    {'angle':   0, 'amplitude':  1.0},
    {'angle':  45, 'amplitude':  2.5},
    {'angle': 135, 'amplitude':  1.8},
    {'angle': 270, 'amplitude':  0.5},
])
Custom Point and Video Styling
These methods allow you to customize the appearance of points by using images or videos.
Set Point Image Style
Sets the fill style of points using an image. The image can be provided as a local file path or a URL.
# Use an image from a local file as the point style:
series.set_point_image_style("path/to/local_image.png")

# Or use an image from a URL:
series.set_point_image_style("https://example.com/image.jpg")
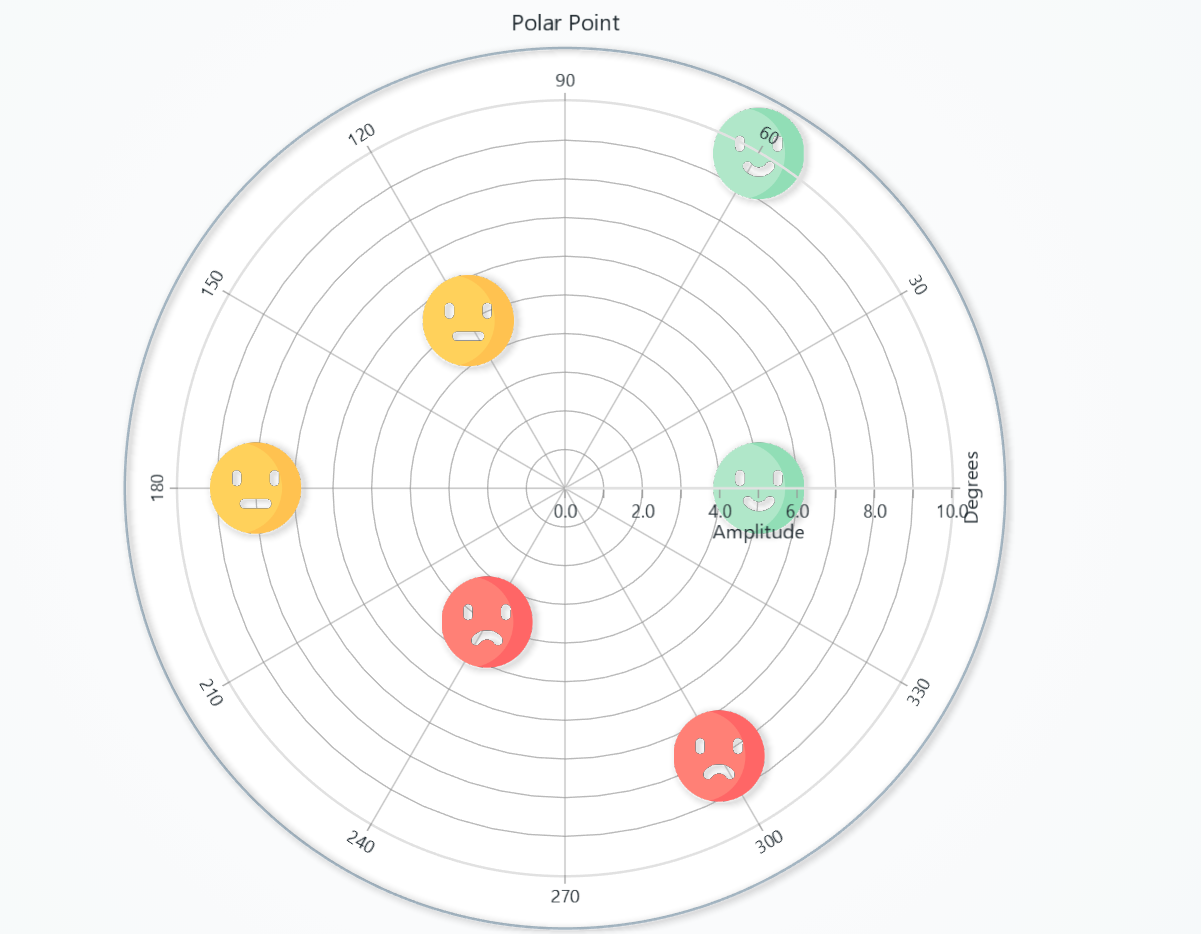
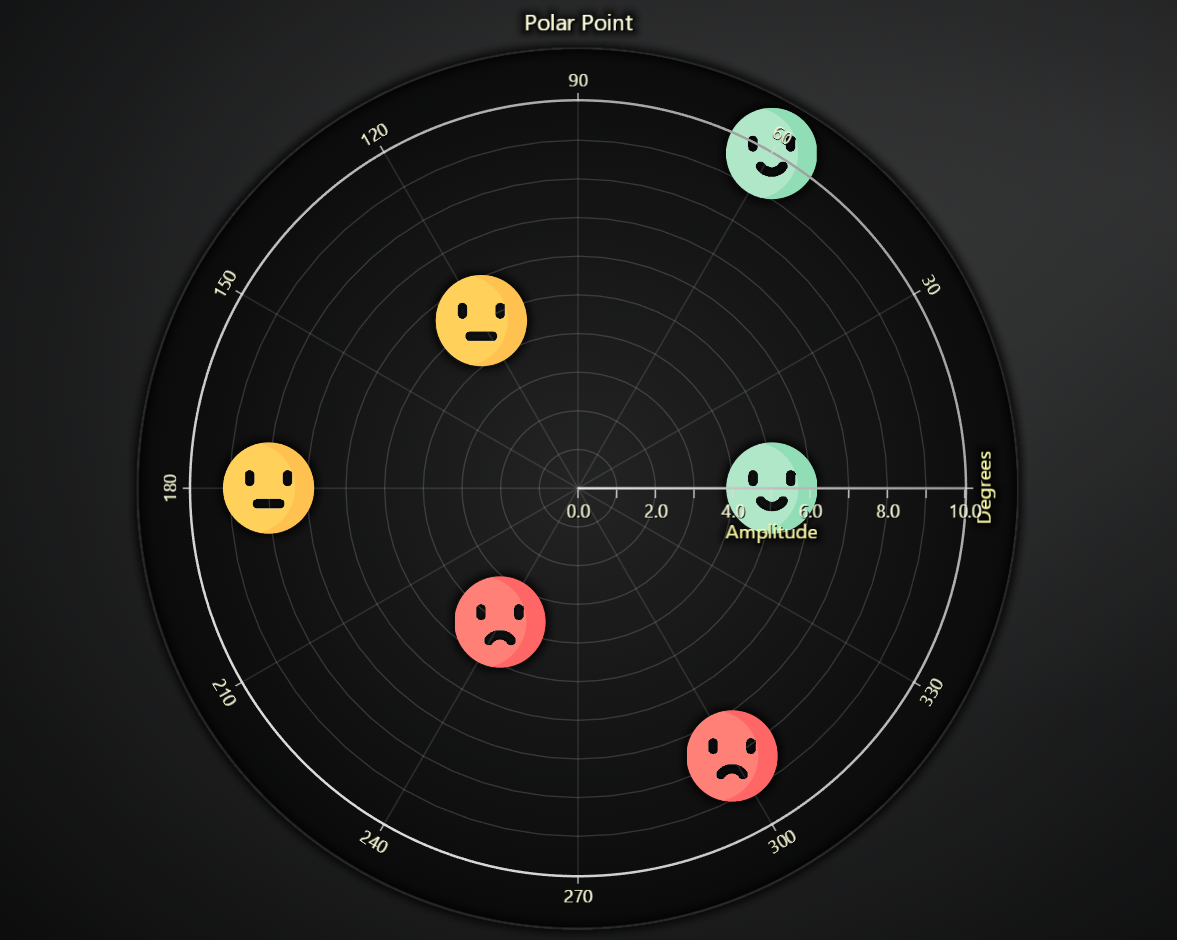
Set Custom Point Shape
Allows setting a custom shape for points by using an icon.
# Use an icon from a local file as the point style:
series.set_custom_point_shape("path/to/local_icon.png")

# Or use an icon from a URL:
series.set_custom_point_shape("https://example.com/icon.jpg")
Set Point Video Style
Sets the point fill style to a video.
# Set a video style for points using a local video file:
series.set_point_video_style("D:/path/to/local_video.mp4")

# Or use a video from a URL with a different fit mode:
series.set_point_video_style("https://example.com/video.mp4")
Point Styling
Control individual point shapes, sizes and colors.
# Set a common shape for all markers:
series.set_point_shape('diamond')   # arrow | circle | cross | diamond | minus | plus | square | star | triangle

# Set stroke style for line drawn around edges of the points
series.set_point_stroke_style(style='solid', thickness=2, color="#ff0000")

# Override all point colors with a single fill color:
series.set_point_color('#FF8800')   # any CSS color

# Uniform size (pixels) for all point markers:
series.set_point_size(8)

# Rotate all point markers by an angle (degrees):
series.set_point_rotation(45)
Series Options
In addition to basic point styling, Polar scatter series support automatic axis scrolling/fitting and per-point coloring.
# Enable per-point colors (required if your data dicts include a "color" field):
series.enable_individual_point_colors()

# Include this series in auto-scroll/fit logic for its axes:
series.set_auto_scrolling_enabled(True)

# Adjust how each point aligns inside its marker:
series.set_point_alignment(x=0.5, y=-0.5)
Series Utility Methods
This section works the same as for Line, to avoid duplication of guides, please refer to the section under Line
Legend
Please see common legend section.